5 Why Analysis
What is 5-Why Analysis?
5-Why analysis is an iterative root cause analysis (RCA) technique used to explore the cause-and-effect relationships underlying a specific problem. By repeating the question "Why?" five times, teams can peel away layers of symptoms to find the systemic root cause.
Originally popularized by Sakichi Toyoda for the Toyota Production System, the 5-Why method is now a foundational tool in Lean, Six Sigma, and modern process improvement.
Does it have to be exactly five? No. The "5" is a rule of thumb. Some problems are solved in three whys, while others might require seven or eight. The goal is to stop thinking about the symptom and start thinking about the system. You have reached the root cause when the answer points to a process or policy that management can actually change.
How the 5-Why Analysis Method Works
A 5-Why analysis begins with a clearly defined problem statement. The team then asks why the problem occurred and records the answer. Each answer becomes the basis for the next “why” question, gradually moving from symptoms toward the underlying root cause.
For example:
- Why did the defect occur?
- Why did that condition happen?
- Why was the process operating that way?
- Why was the system designed or managed that way?
- Why was that decision made?
By repeatedly asking why, teams move beyond surface-level explanations and identify the process or management conditions that allowed the problem to occur. Once the root cause is understood, corrective actions can be implemented to prevent recurrence.
How to Perform a 5-Why Analysis
To get the most out of this tool, follow these steps:
- Get the right people in the room: Gather people who have hands-on experience with the process being analyzed.
- Define the Problem: Write a clear, objective "Problem Statement." Avoid jumping to conclusions here; just state what is happening.
- Ask the First "Why?": Why is this specific problem occurring? Document the answer as a direct cause.
- Iterate Until the Root is Found: For every answer provided, ask "Why?" again. Continue this until the team identifies a systemic failure (often related to management, training, or process design).
- Identify Countermeasures: Develop a plan to prevent the root cause from recurring, rather than just treating the symptom.
- Monitor the Results: Track the effectiveness of your solution to ensure the problem has truly been eliminated.
5-Why Analysis Examples
Example 1: Manufacturing (Inventory & Lot Sizes)
- Symptom: There is too much work-in-process (WIP) inventory, yet we never have the right parts.
- Why? The press room does not respond quickly enough to demand.
- Why? It takes too long to change over between parts, so lot sizes are kept intentionally large.
- Why? Stamping dies must be reconfigured in the tool room between runs, taking up to eight hours.
- Why? The original project team skimped on the number of dedicated dies to stay under the building budget.
- Root Cause: Management did not prioritize Lean manufacturing targets (like small lot sizes) during the plant launch.
Example 2: Service/IT (High Customer Churn)
- Symptom: 15% of new trial users cancel their subscription before the first month ends.
- Why? Users find the software too difficult to set up.
- Why? They are failing to complete the "Initial Configuration" wizard.
- Why? The wizard asks for technical API data that the user doesn't have on hand.
- Why? We designed the onboarding flow for IT Managers, but the primary users are HR Coordinators.
- Root Cause: The product design team used an incorrect customer persona for the onboarding UX development.
5-Whys vs. Fishbone (Ishikawa) Diagram
While both are root cause tools, they serve different purposes. The 5-Why method is a "drill-down" tool that follows a single linear path. The Fishbone Diagram is a "brainstorming" tool used to identify multiple contributing factors across different categories (Man, Machine, Method, etc.).
When to use 5-Why vs. Fishbone Diagram:
| Feature | 5-Why Analysis | Fishbone Diagram |
|---|---|---|
| Feature: Problem Type | 5-Why Analysis: Simple to Moderate | Fishbone Diagram: Complex/Multi-faceted |
| Feature: Logic | 5-Why Analysis: Linear (Cause -> Effect) | Fishbone Diagram: Holistic (Categorical) |
| Feature: Best For | 5-Why Analysis: Finding a single systematic path | Fishbone Diagram: Visualizing all possible causes |
Historical Perspective
The 5-Why technique was a primary tool of the Toyota Production System and popularized by Sakichi Toyoda. A key philosophy of the method is that "people don't fail, processes do." By the time you ask "Why?" five times, you will almost always find that the problem originated in management practices, lack of training, or poor resource allocation.
As Benjamin Franklin famously illustrated in Poor Richard's Almanac, a kingdom can be lost "all for the want of a horseshoe nail." 5-Why analysis is the modern way to find that nail.
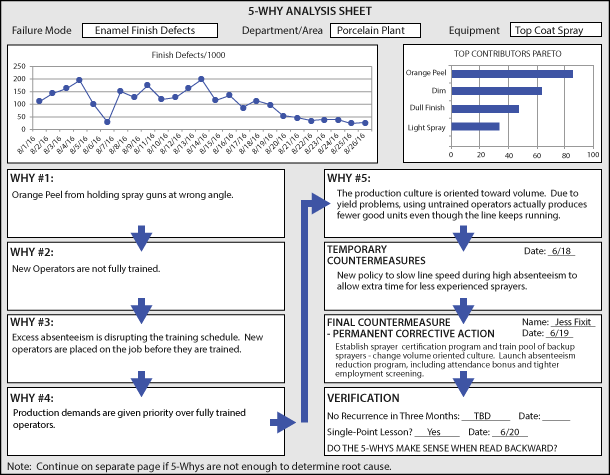
Hybrid 5-Why Tools
In advanced environments, the 5-Why method is often integrated with other data-driven tools. For example, a Japanese transplant automobile manufacturer uses a hybrid form that includes a trend chart and Pareto chart to guide the 5-Why thinking of its problem-solving teams.
On one piece of paper, the form captures:
- Historical data
- Problem priorities
- Root cause analysis
- Corrective action
- Verification
Below is an example of this hybrid form using a hypothetical scenario from an appliance manufacturer:
Using 5-Why Tools in EngineRoom
For teams dealing with complex, data-heavy problems, manual tracking can be difficult. Our data analysis and stats software, EngineRoom, features a specialized Hybrid 5-Why Tool that integrates trend charts and Pareto data directly into your analysis.
5-Why Analysis Tutorial in EngineRoom:
Pro-Tips for a Disciplined 5-Why Analysis
To ensure your team reaches a truly actionable root cause rather than just identifying a list of symptoms, keep these best practices in mind:
- Avoid the "Blame Game": The purpose is to find a defect in the process, not the person. If your 5-Whys end with "Human Error," you likely need to ask "Why?" at least once more to find the training or systemic gap.
- Don't Stop Too Early: A common mistake is stopping as soon as a plausible reason is identified. These early conclusions often only address the symptom. Push the team to go deeper until you reach a point where management can make a definitive, positive difference.
- Verify the Path: Ensure there is a logical, evidence-based connection between each "Why." If you skip a step in the logic, you may end up solving the wrong problem.
- Involve the "Doers": Success depends on having the right people in the room—those who are actually involved in the daily operation of the process being discussed.
Related Tools & Resources:
- Root Cause Analysis Overview: Visit our main resource hub for a comprehensive look at the methodologies used to solve complex problems and prevent recurrence.
- Fishbone (Ishikawa) Diagram: The "Sister Tool." If 5-Whys is too simple for the problem, this is the next step.
- Pareto Chart: The "Prioritization Tool." Use this to explain how you decide which 20% of problems to perform a 5-Why on first.
- Failure Mode and Effects Analysis (FMEA): The "Proactive Tool." While 5-Whys reacts to a problem that happened, FMEA tries to predict them.
- A3 Problem Solving: The "Framework." 5-Whys is often just one small box inside a full A3 report.
Deep Dives into the Future of RCA
- Blog: What’s the Next Big Tool for Root Cause Analysis? – Explore how RCA is evolving beyond traditional methods.
- Webinar: The Future of Root Cause Analysis – Watch our experts discuss how data and technology are changing the way we solve problems.