Stop Overcomplicating Data Analysis: 5 EngineRoom Features You Need to Try
Data analysis is an important part of Lean Six Sigma and process improvement, yet many practitioners find themselves spending more time navigating software than gleaning insights to solve problems. Whether it’s searching for the right tool, structuring analyses, or interpreting complex outputs, the process can feel overwhelming—especially when efficiency and accuracy are critical to success.
That’s where EngineRoom makes a difference. Whether you need a guided approach to selecting the right tool, an intuitive way to organize data, or recommendations that remove uncertainty, EngineRoom simplifies every step of the analysis process.
In this blog, we’ll explore five key features that make data analysis easy in EngineRoom, helping you to interpret results with confidence, solve problems faster, and drive meaningful improvements in your organization.
Critical Thought Map & Question Menu
Process improvement work requires a structured approach to problem-solving, but even when taught a particular problem-solving roadmap, practitioners still struggle with knowing where to start or which tools to use. EngineRoom’s Critical Thought Map (CTM) and Question Menu solve this by providing a guided approach to problem-solving in app. These features help users map out their thought processes and match the right tool to the question they are trying to answer.
Why It Matters for Lean Six Sigma:
The CTM and Questions Menu in EngineRoom provides a guided approach to critical thinking, ensuring teams ask the right questions at the right time. These questions integrate directly with DMAIC, offering relevant tool recommendations for each phase. By structuring problem-solving this way, practitioners can connect data to decisions more effectively, leading to more meaningful analysis and better project outcomes.
How It Simplifies Data Analysis:
The Questions Menu suggests the appropriate statistical tools, eliminating guesswork and helping users to better navigate the analysis process with confidence.
For example, during the Define phase of DMAIC, users might see the question, "What is the problem we are trying to solve?" The menu then suggests tools like a Project Charter or Value Stream Map, helping users determine the best way to answer that question.
The CTM allows users to map out their problem-solving process, linking their question, chosen tool, and conclusion in one place. This structure keeps projects organized and focused, reducing time spent searching for the right method. It also provides incredible visibility to the project sponsor or champion regarding the project. Unlike traditional statistical software, EngineRoom combines structured thinking with guided analysis, making data-driven decision-making more efficient and systematic.
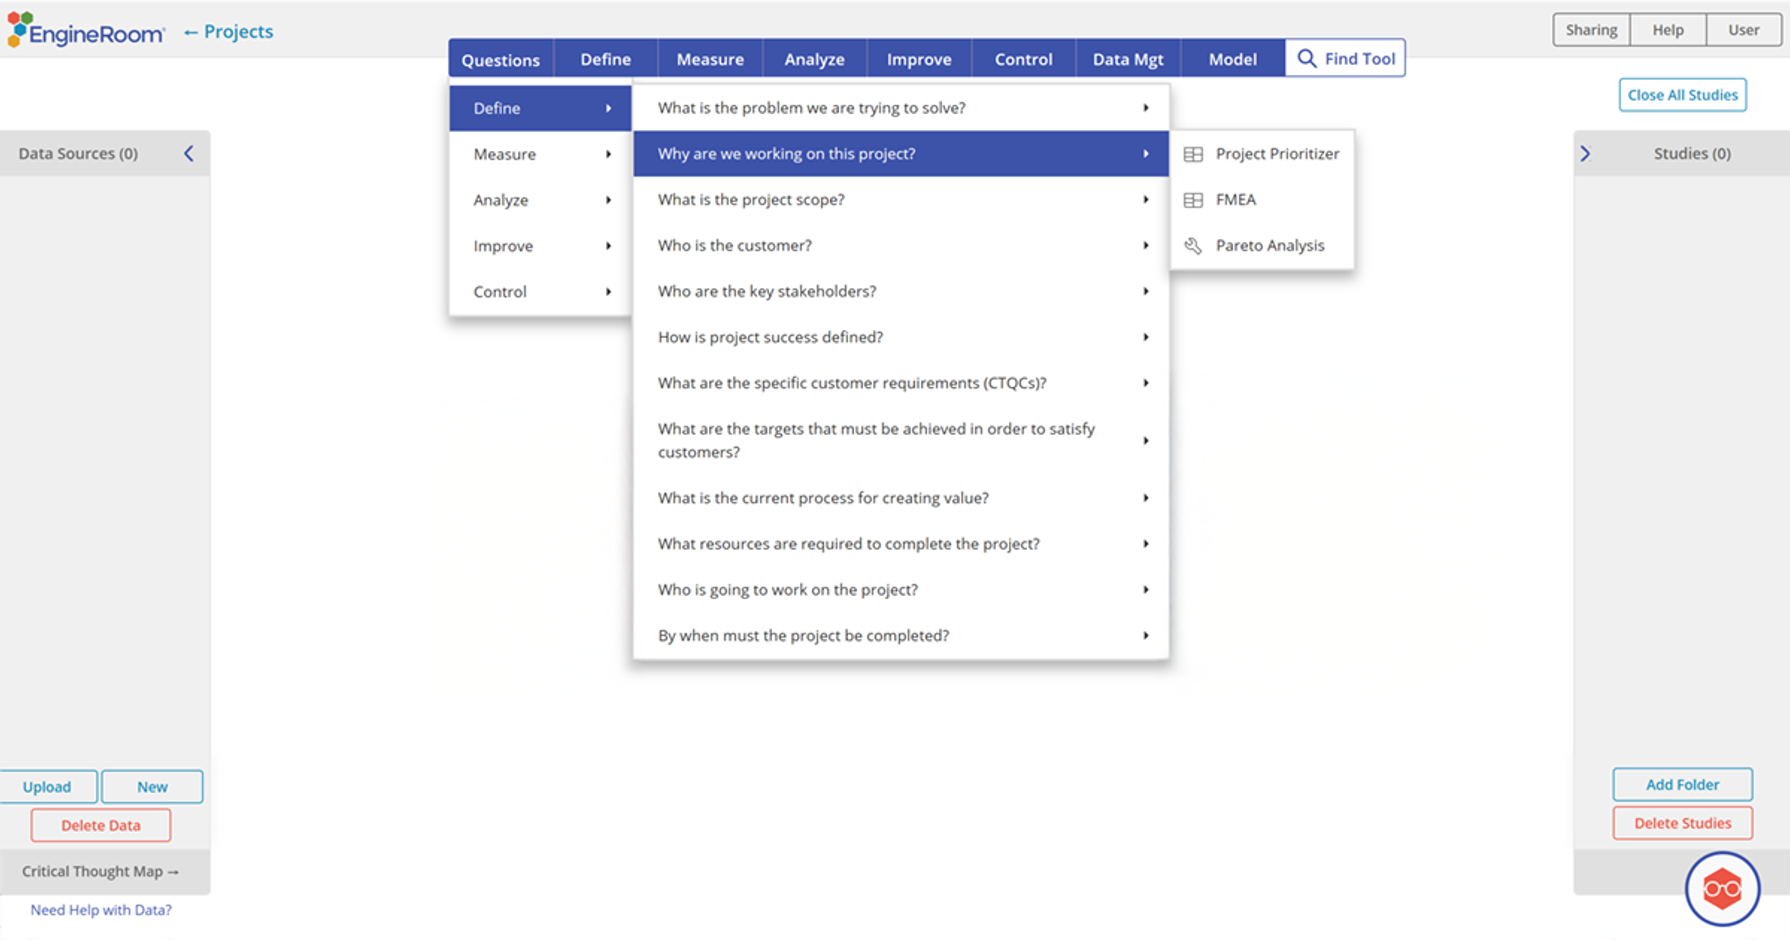
Click the Image to view larger.
EngineRoom is Organized by DMAIC (or DCDOV, PDCA/PDSA)
One of the most common things we hear from process improvement professionals is how valuable it is that EngineRoom is organized by DMAIC—a feature that sets us apart. While many organizations follow DMAIC, others rely on PDCA/PDSA, DCDOV, or a more general statistical approach. EngineRoom accommodates them all, ensuring that no matter how a team structures its improvement work, the tools they need are logically grouped and easily accessible.
Why It Matters for Lean Six Sigma
Process improvement requires structured analysis, and EngineRoom’s flexible organization system allows users to work within their preferred methodology while keeping tools and analyses aligned by phase. Users can:
- Choose a roadmap that aligns with their organization’s process improvement framework (DMAIC, PDCA/PDSA, DCDOV, or standard menu).
- Find relevant tools faster, since each roadmap organizes analysis options by phase rather than scattered menus.
For those who prefer a more traditional organization, EngineRoom also offers a Standard Menu, where tools are categorized by function, such as Planning, Graphs, Quality Tools, Statistics, Lean Tools, Closeout, and Machine Learning.
How It Simplifies Data Analysis
By structuring all the tools needed for each phase of analysis in one place, EngineRoom removes the guesswork of searching for the right method.
For example, in the Analyze phase of DMAIC, users immediately see tools such as Cause and Effect Matrix, Design of Experiments, Regression Analysis, and so on—ensuring they can move straight into analysis without wasting time navigating through complex menus.
EngineRoom is designed with process improvement in mind. Whether a team follows DMAIC, PDCA/PDSA, or DCDOV, EngineRoom ensures that users spend less time searching for tools and more time-solving problems.
Drag-and-Drop Data Selection
When working with data, ease of use matters. One of the standout features that sets EngineRoom apart is its Drag-and-Drop Data Selection— a simple yet powerful way to manage data without getting lost in menus or complex file structures. This feature is particularly valuable for new Lean Six Sigma practitioners, as it removes technical barriers associated with statistical software. By allowing users to select and organize their data visually, EngineRoom makes it easier to see what’s being analyzed and ensures that the correct inputs are being used for each study.
Why It Matters for Lean Six Sigma
Clear, structured data selection is essential for accurate analysis. EngineRoom’s intuitive drag-and-drop system makes working with data straightforward by:
- Eliminating confusing menu navigation—users simply drag their dataset into designated drop zones.
- Providing a clear visual connection between data and analysis, making it easy to track which variables are being used in a study.
This feature is particularly beneficial for those new to statistical software, as it simplifies the process and allows them to focus on insights rather than software complexity.
How It Simplifies Data Analysis
Rather than clicking through multiple menus to assign data to an analysis, EngineRoom’s drag-and-drop interface is designed with new users in mind, helping users quickly understand their analysis setup and proceed with confidence.
Conclusions & Quick Reference Tables
Interpreting statistical results can be one of the biggest hurdles in data analysis. Many Lean Six Sigma practitioners, especially those new to working with statistical outputs, struggle to determine the most critical takeaways from their analysis quickly. EngineRoom simplifies this process by providing clear, automated conclusions and a Quick Reference Table, ensuring users immediately see the most relevant results without digging through complex statistical reports.
Why It Matters for Lean Six Sigma
Statistical analysis is only as valuable as the insights it provides. EngineRoom’s Conclusions and Quick Reference Tables help Lean Six Sigma professionals:
- Quickly interpret results—key takeaways are summarized clearly
- Eliminate uncertainty—users don’t have to sift through multiple statistics to determine what’s important.
- Save time in decision-making—conclusions and key data points are highlighted for faster analysis and action.
This feature ensures practitioners can confidently extract meaningful insights from their data.
How It Simplifies Data Analysis
Instead of manually interpreting raw statistical outputs, EngineRoom presents conclusions and recommendations upfront, surfacing the most relevant information to streamline decision-making.
For example, after running a hypothesis test, EngineRoom automatically provides a conclusion as displayed in the image below.
Additionally, for tools like Gauge R&R, users not only see the statistical recommendation but also a Quick Reference Table, highlighting the most important statistics for that particular study—so users know exactly what matters without digging through extensive data.
Data Editor with Built-in Cleansing Tools
Before running any analysis, ensuring clean, accurate data is essential. However, many statistical tools require users to prepare and clean their data in separate software before importing it for analysis. EngineRoom eliminates this hassle by integrating built-in data cleansing tools directly into its Data Editor, allowing users to clean, organize, and transform their data all within one platform.
Why It Matters for Lean Six Sigma
Reliable data is the foundation of effective process improvement. EngineRoom’s Data Editor helps users:
- Identify and remove outliers before running an analysis.
- Detect missing or inconsistent data—ensuring accuracy before proceeding.
- Perform basic calculations and data manipulation without switching between multiple tools.
How It Simplifies Data Analysis
Instead of exporting data to a spreadsheet for cleaning, EngineRoom allows users to clean and prepare data within the platform.
For example, users can:
- Check for Outliers that could impact their statistical results.
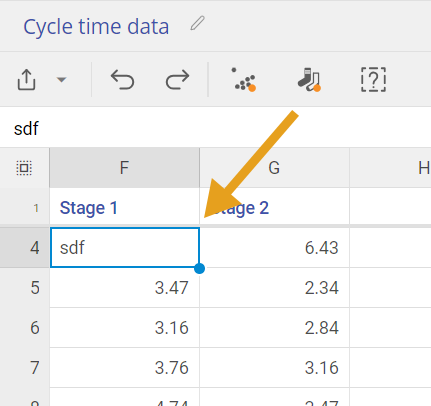
- Check for Inconsistent Data, such as unexpected text in numeric fields.
- Check for Missing Data, and flag gaps before proceeding with an analysis.
Additionally, EngineRoom includes data functions for further data analysis, such as column addition and averaging, ensuring that simple calculations can be done without leaving the software. EngineRoom provides a complete solution by integrating data cleansing and analysis within one platform.
Simplify Data Analysis with EngineRoom
Too often, Lean Six Sigma practitioners spend valuable time navigating complex software, searching for the right tools, or manually preparing data before they can even begin their statistical analysis. EngineRoom eliminates these barriers by offering a structured, intuitive, and efficient platform designed specifically for process improvement.
With features like Drag-and-Drop Data Selection, built-in Data Cleansing Tools, and a structured roadmap aligned with DMAIC and other methodologies, EngineRoom simplifies the analytical process so you can focus on what matters—solving problems and driving meaningful improvements.
No matter the process improvement work you are doing, EngineRoom provides the right tools, in the right place, at the right time—helping you move from data to actionable insights faster and with greater confidence.