
A3 Report
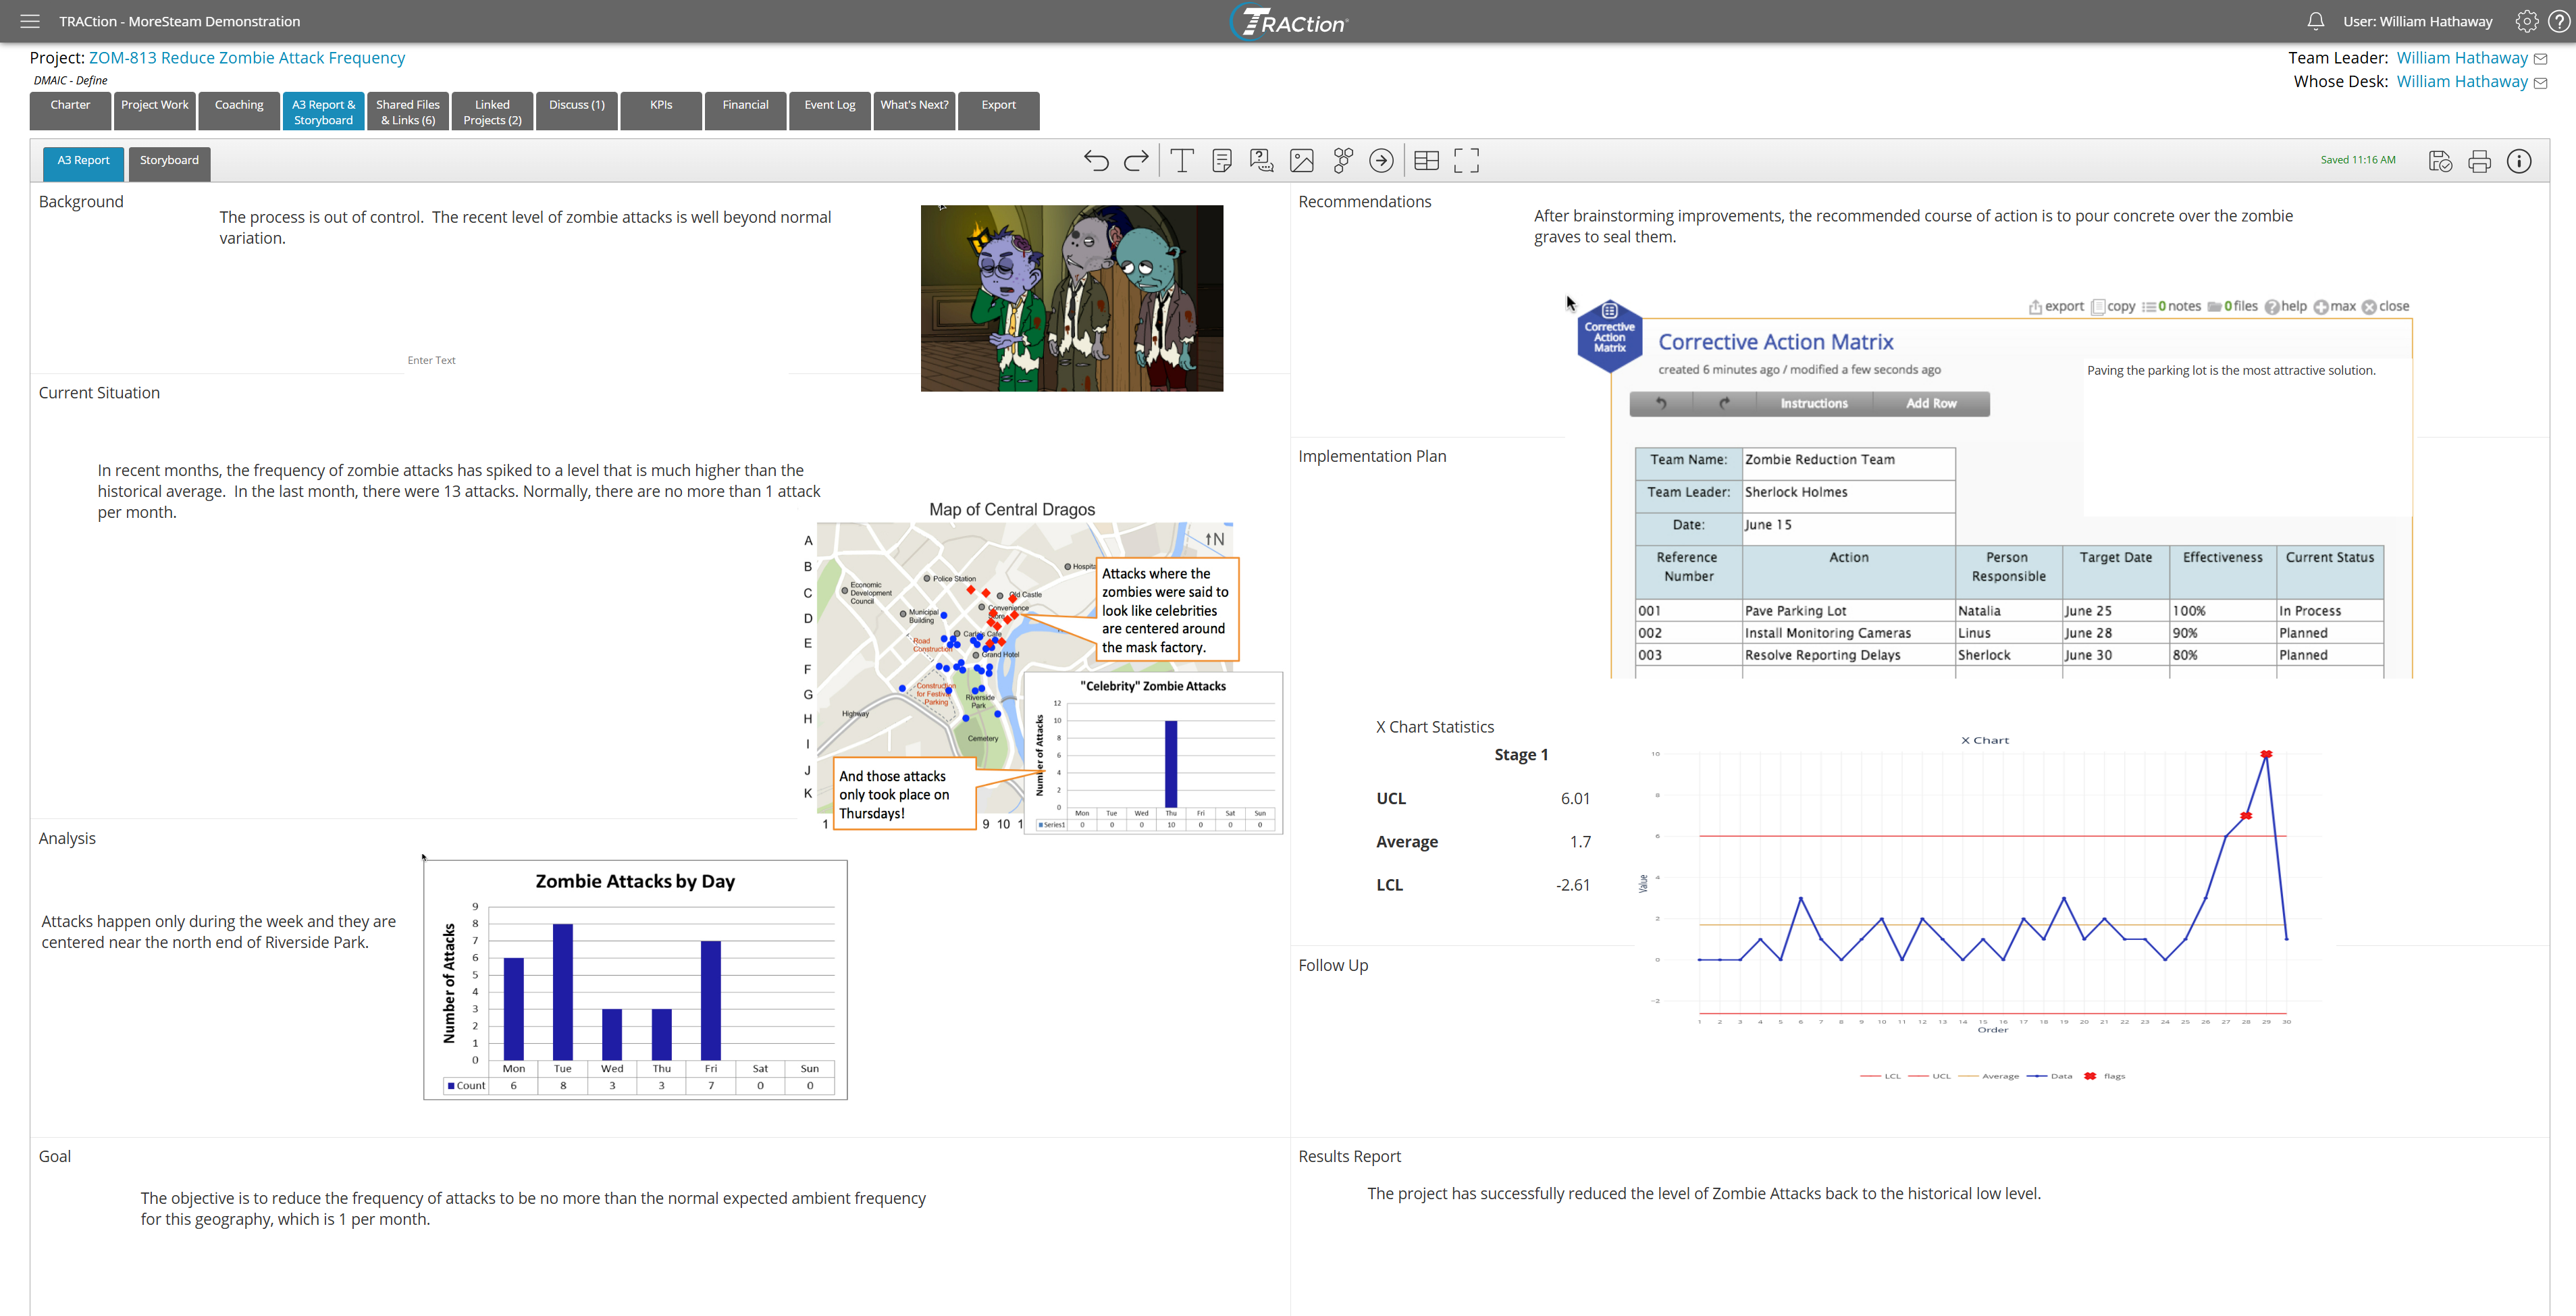
The A3 Report page in TRACtion allows you to build a digital A3 report for your project. A3 Reports help to simplify project reporting as they condense the information to a single page and visually communicate to the reader what the most important takeaways are for the project.
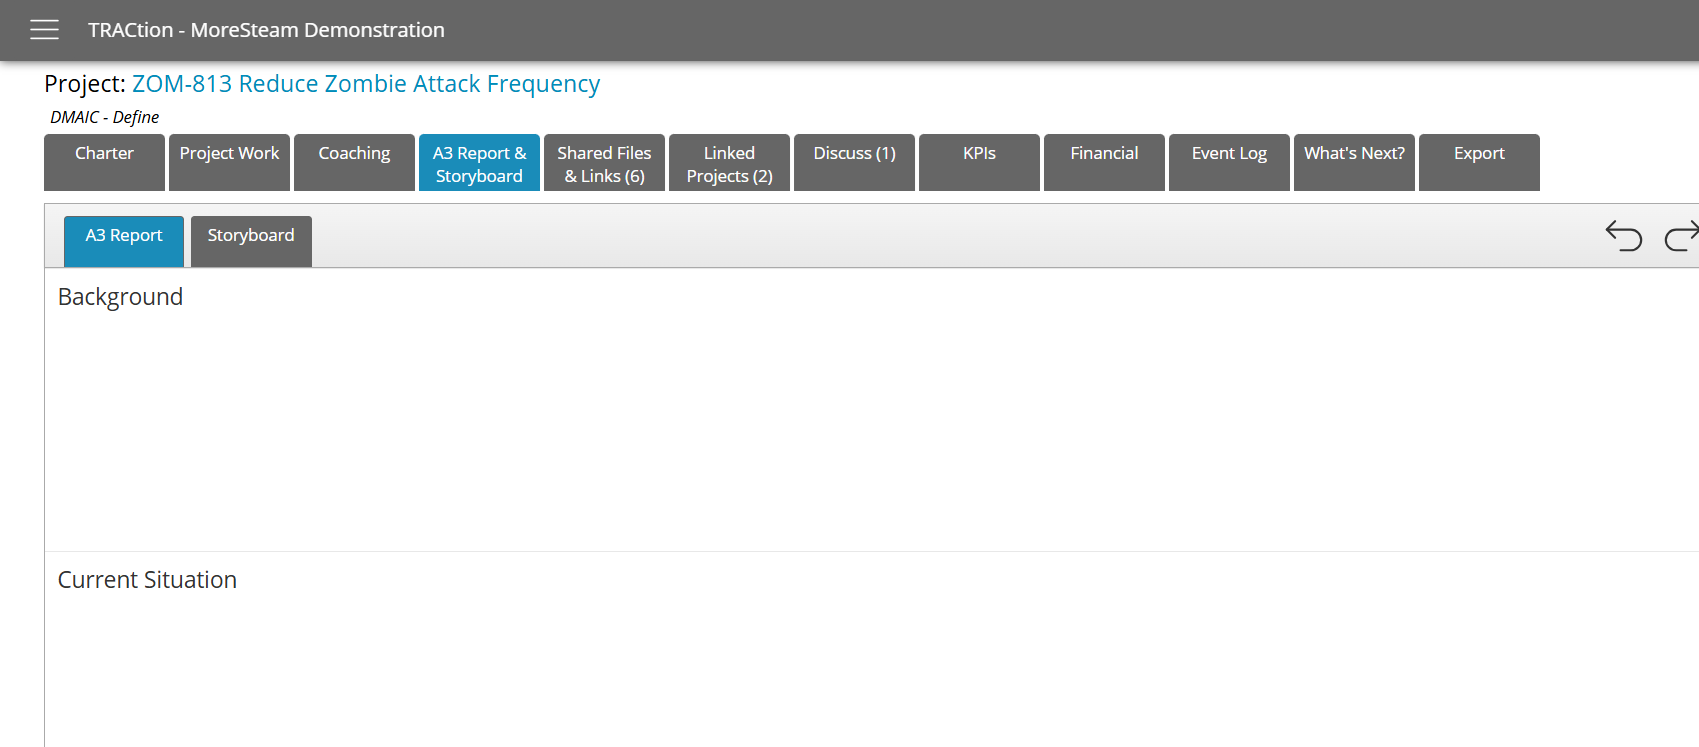
To access the A3 Report of a project, open the project and click the tab for “A3 & Storyboard”. In some instances, this may just say “A3 Report” if the Storyboard has not been enabled or “Storyboard” if the A3 Report has been disabled.
If you are currently working on the project and have the permission to do so, you will be able to make changes to the A3 Report.
Building an A3 Report
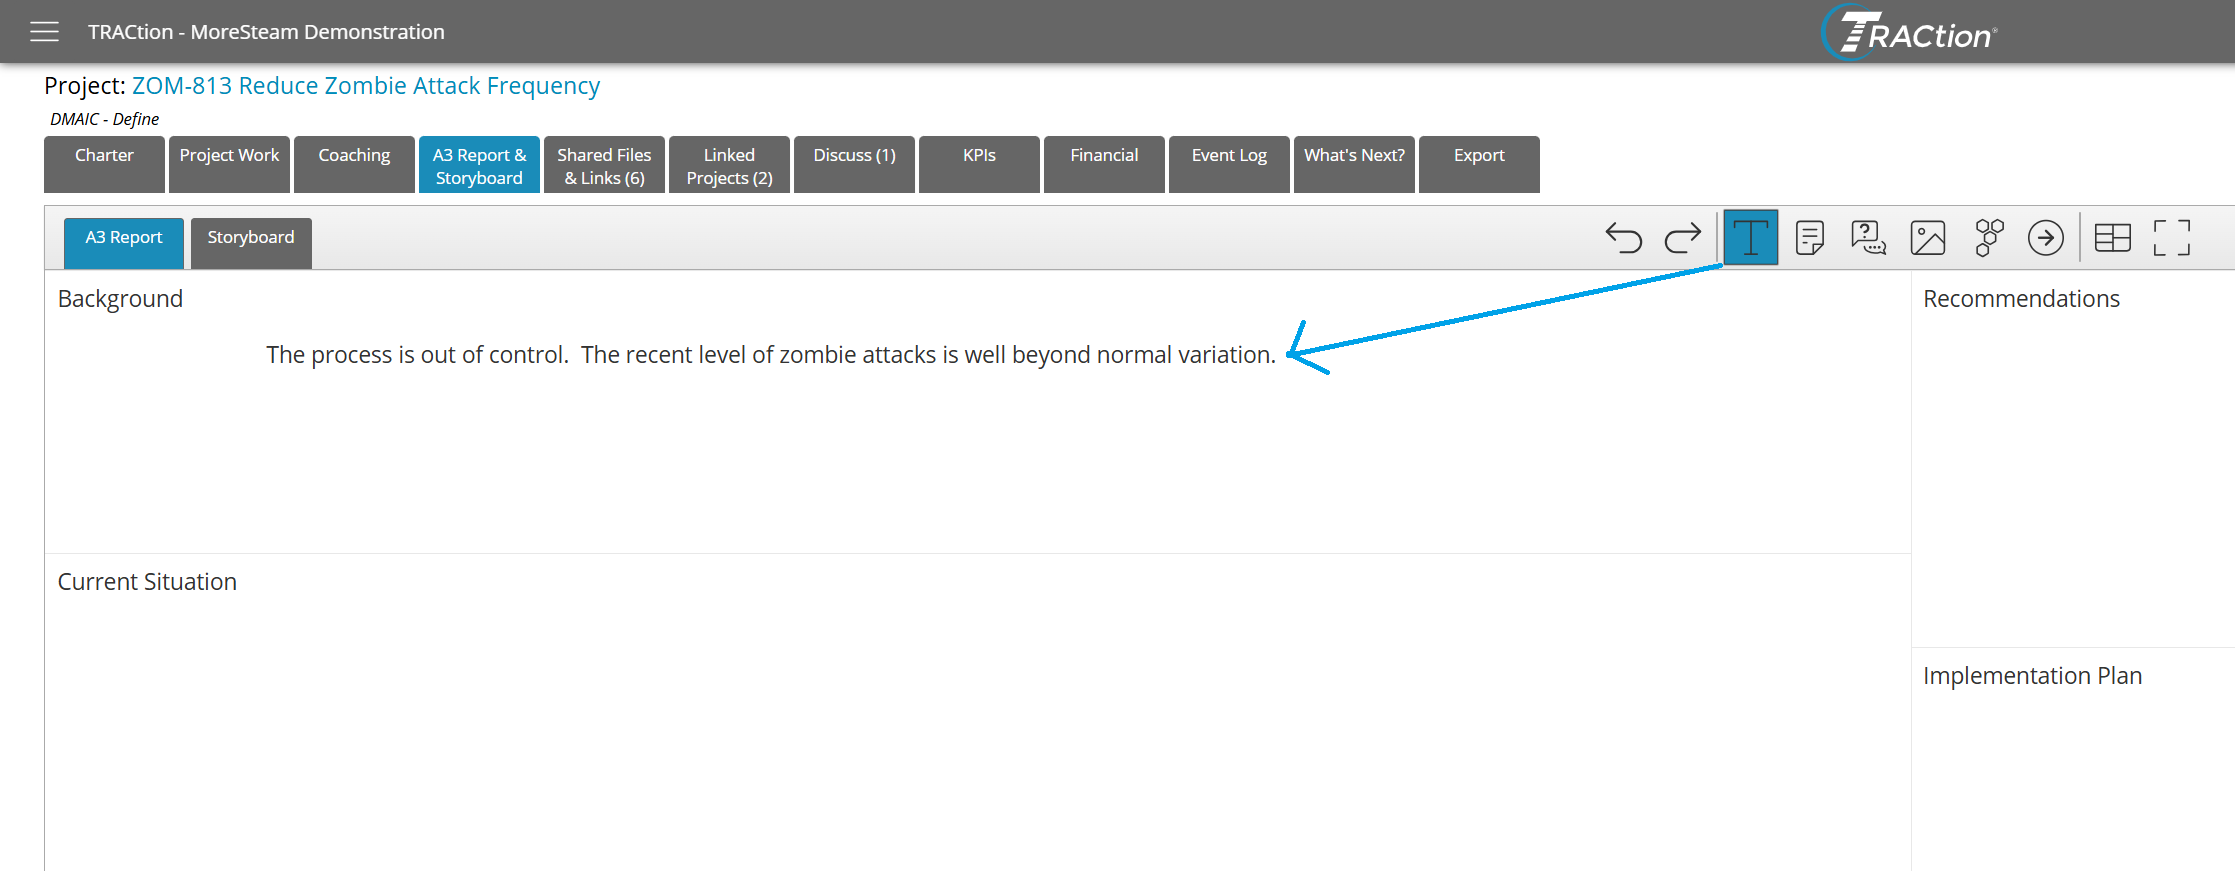
To add freeform text to the A3, click the T icon in the menu. From there, click a blank area of the A3 to begin entering the desired text.
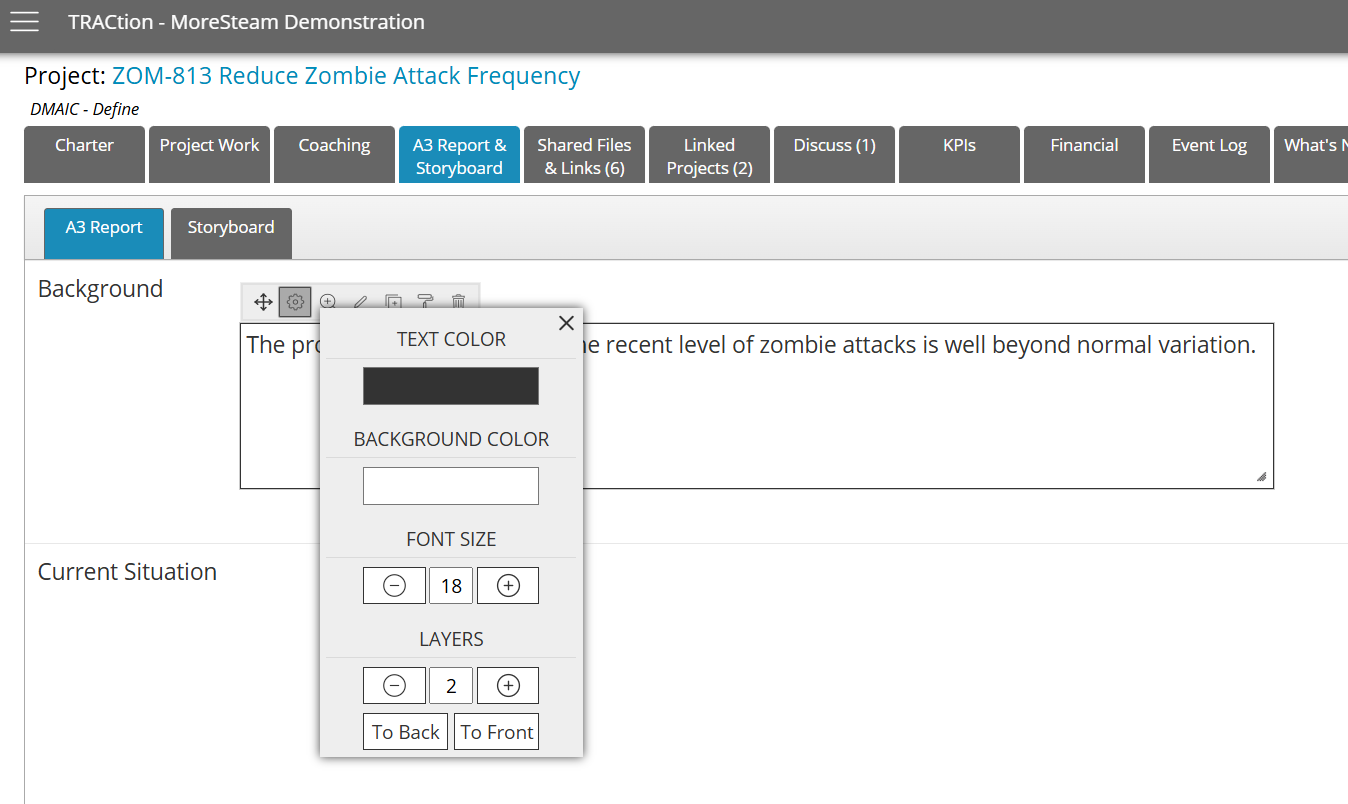
If you are looking to modify how the text looks, you can click the gear icon that appears when hovering over the text to open the settings menu. Here you can change the text & background colors, the font size, and the ordering of the text on the page in the case of elements overlapping.
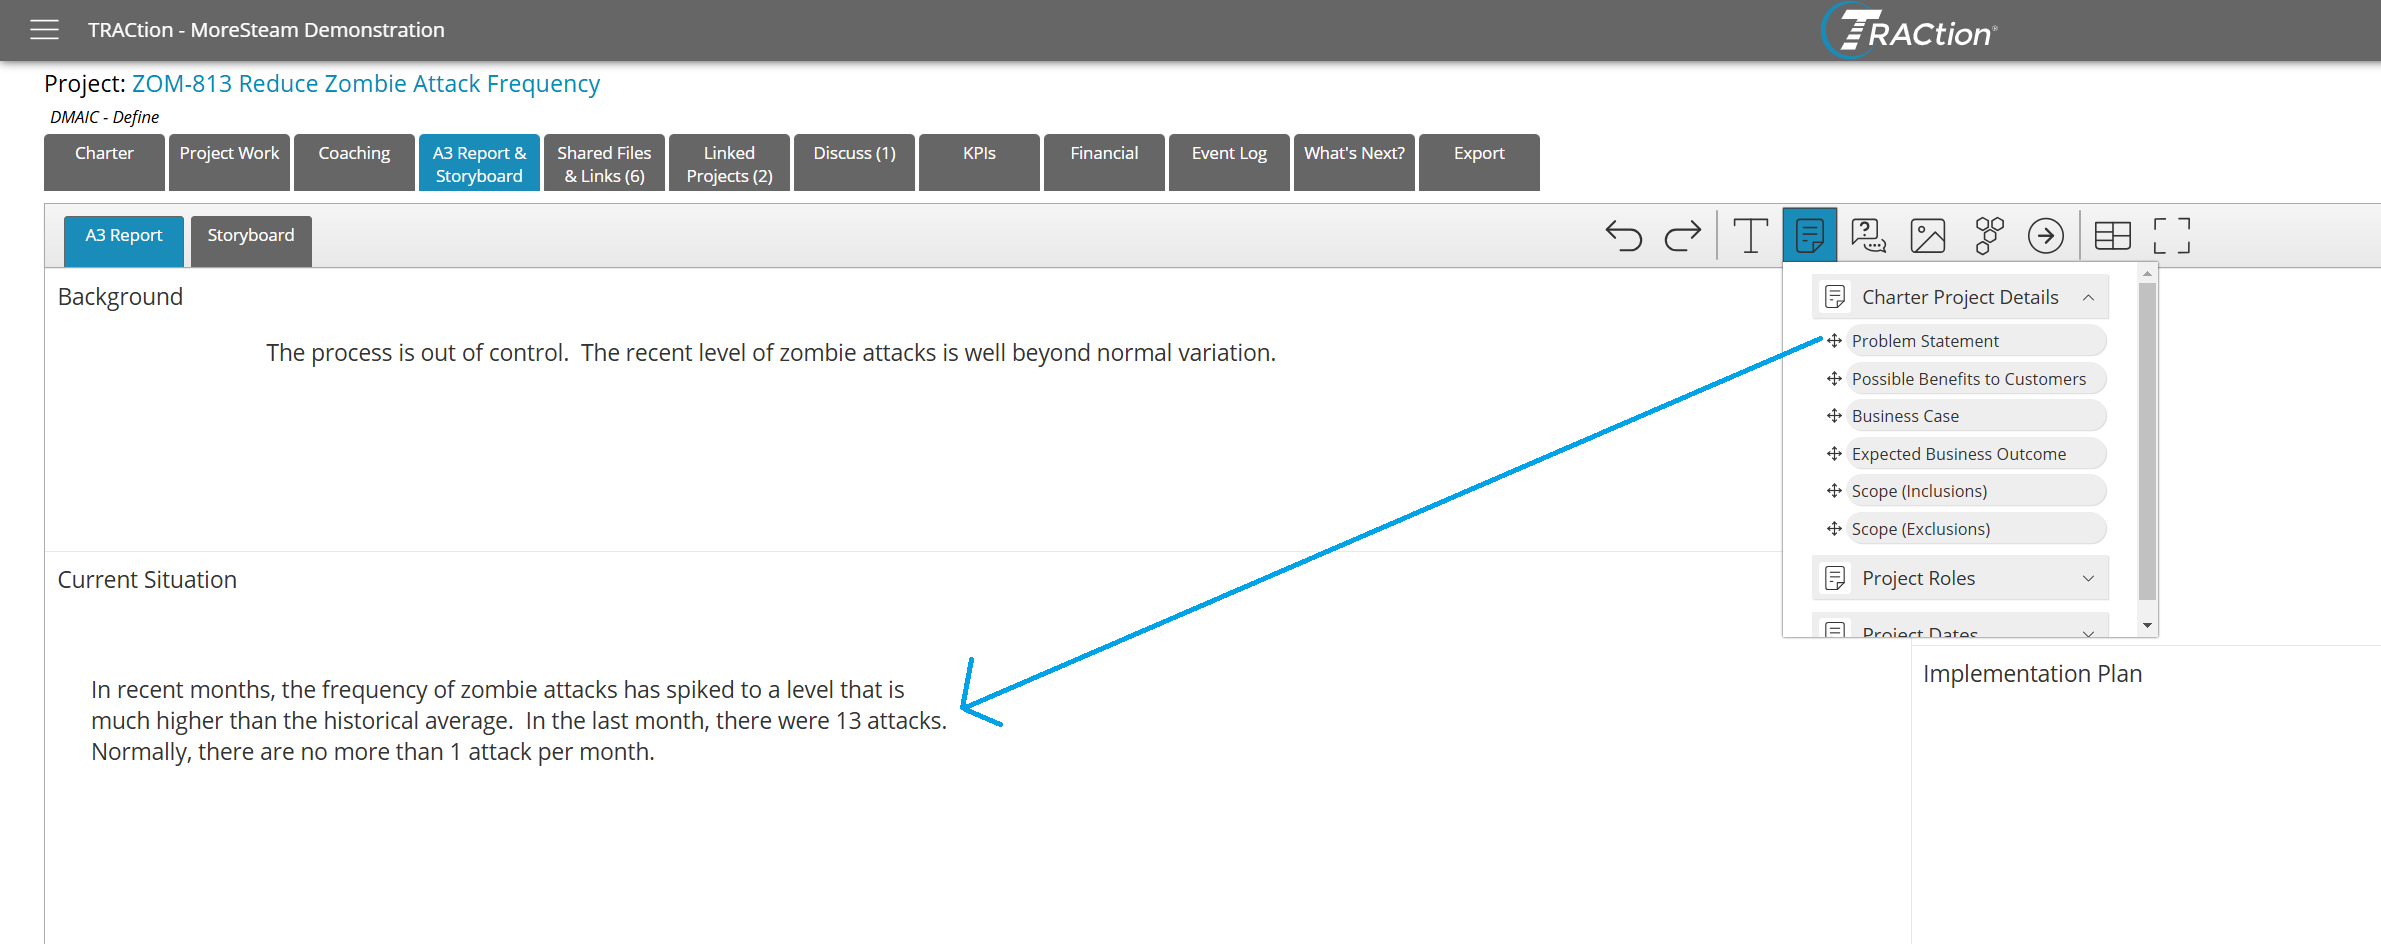
If you’d like to pull in project details from the charter, click the document icon and drag the element you’d like to include onto the A3. In a similar manner to the freeform text, you can hover over the added element and click the gear icon to be able to make adjustments to the text’s appearance.
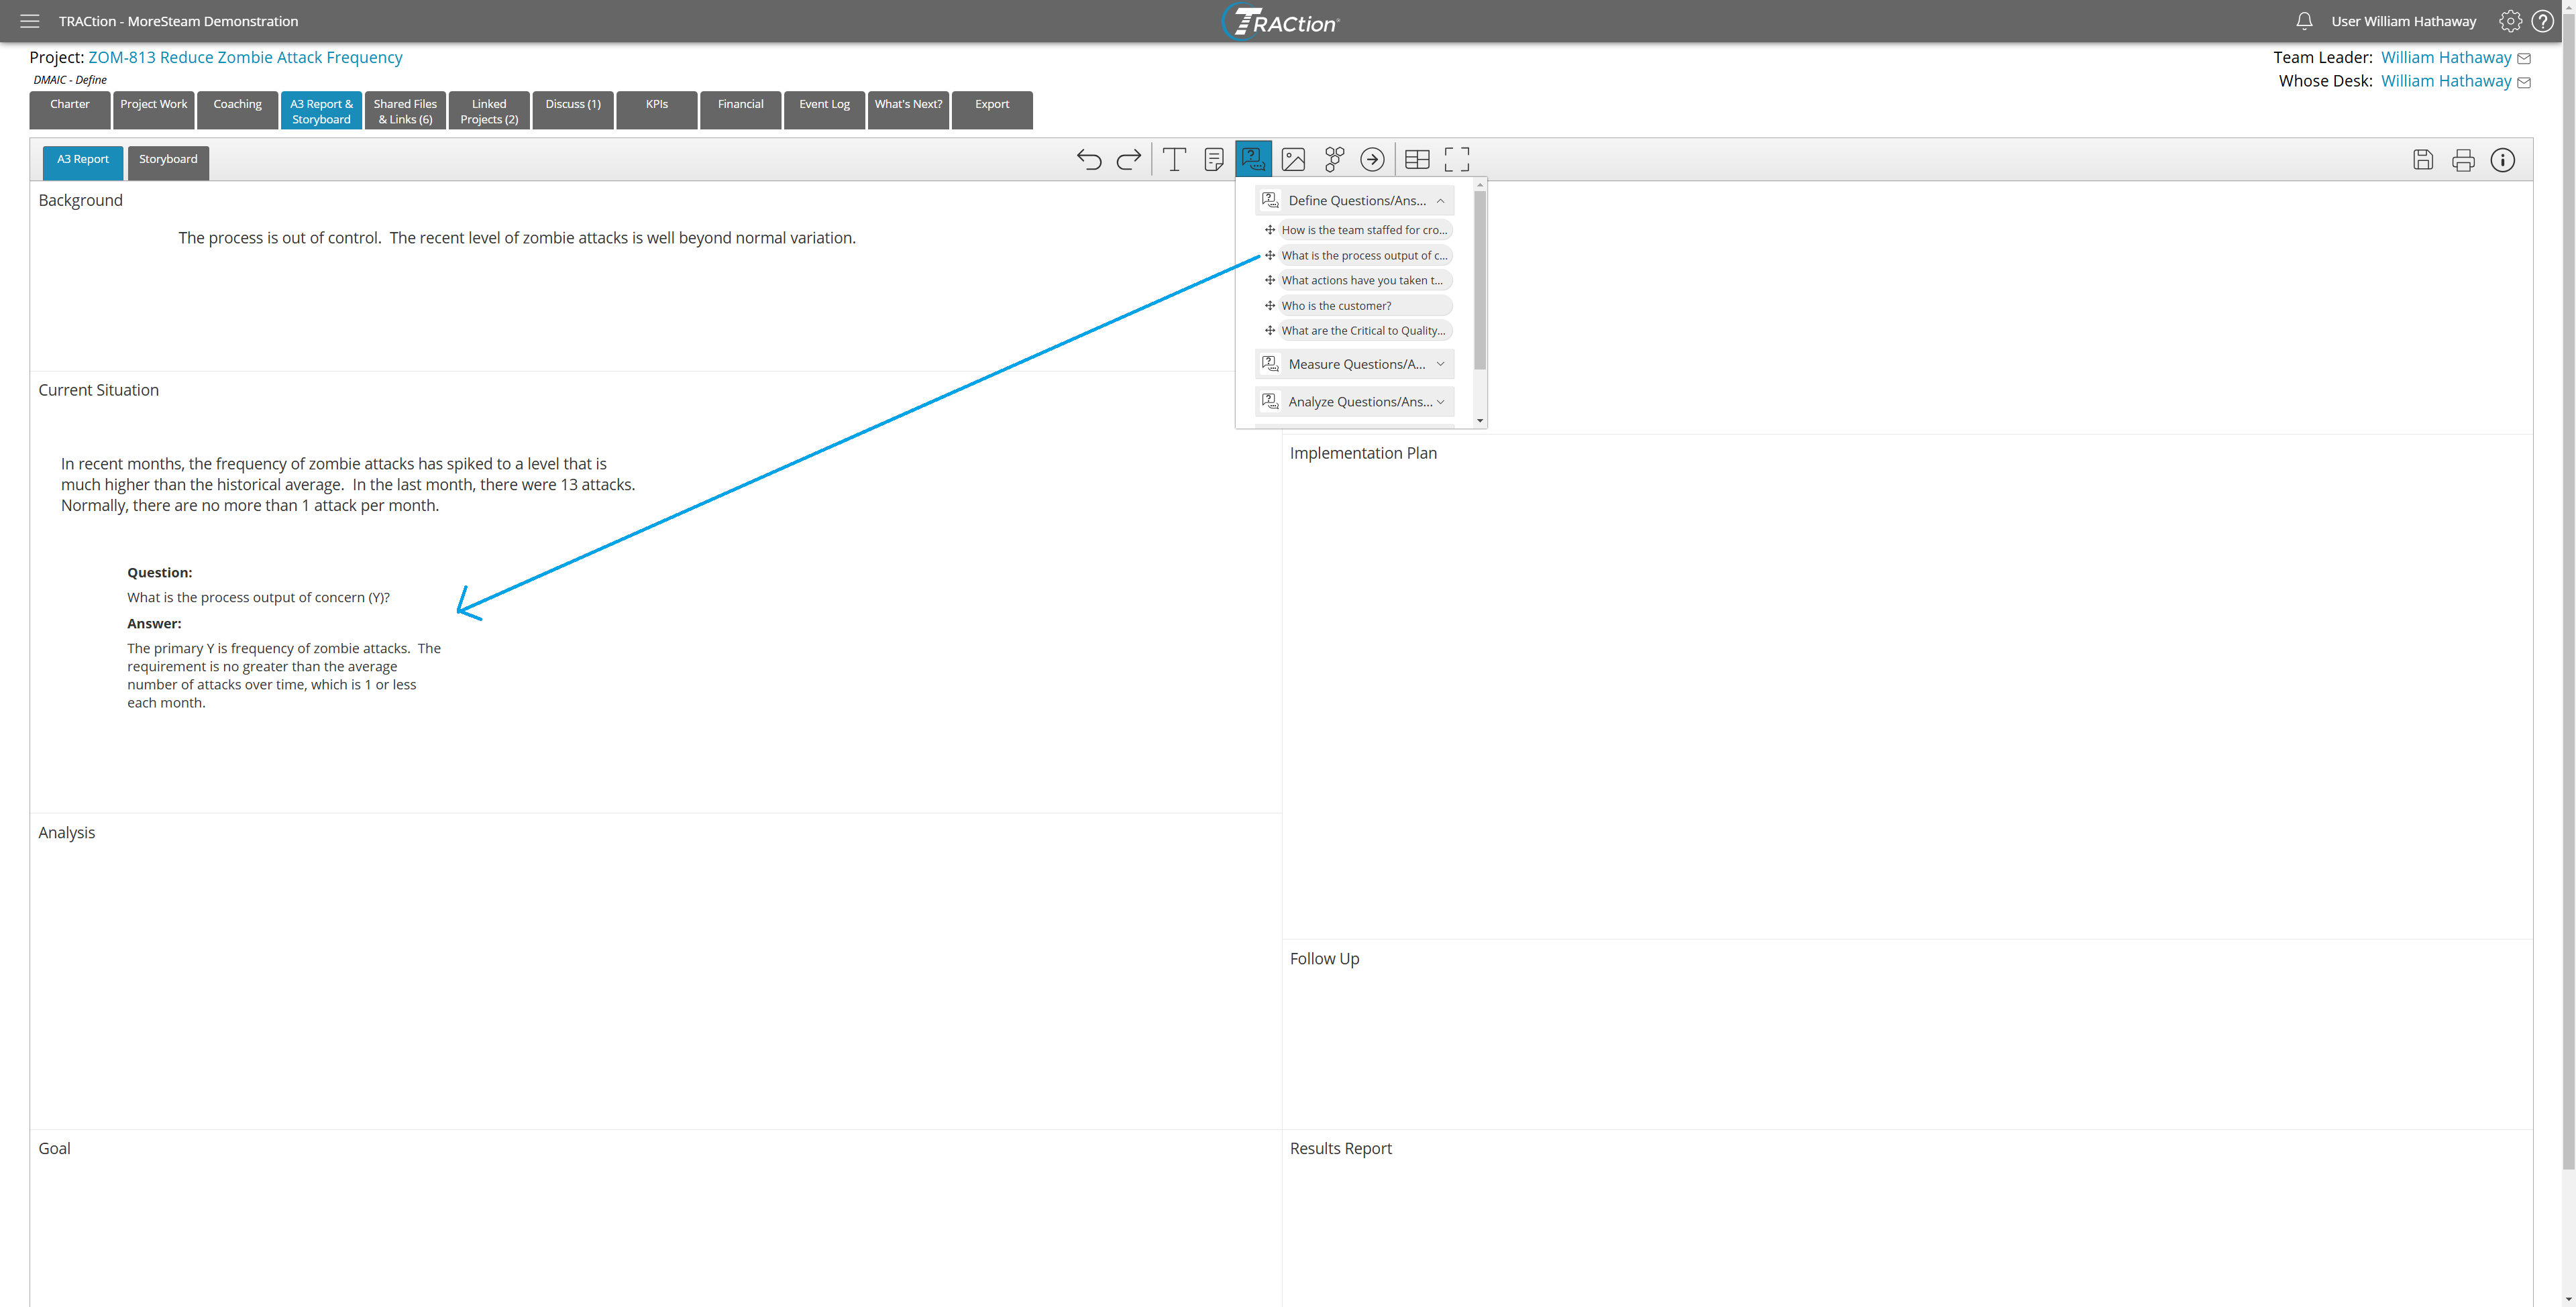
To bring in questions and answers from the project phases, you can click the Questions/Answer icon to pull in the question/answer pairs from your project.
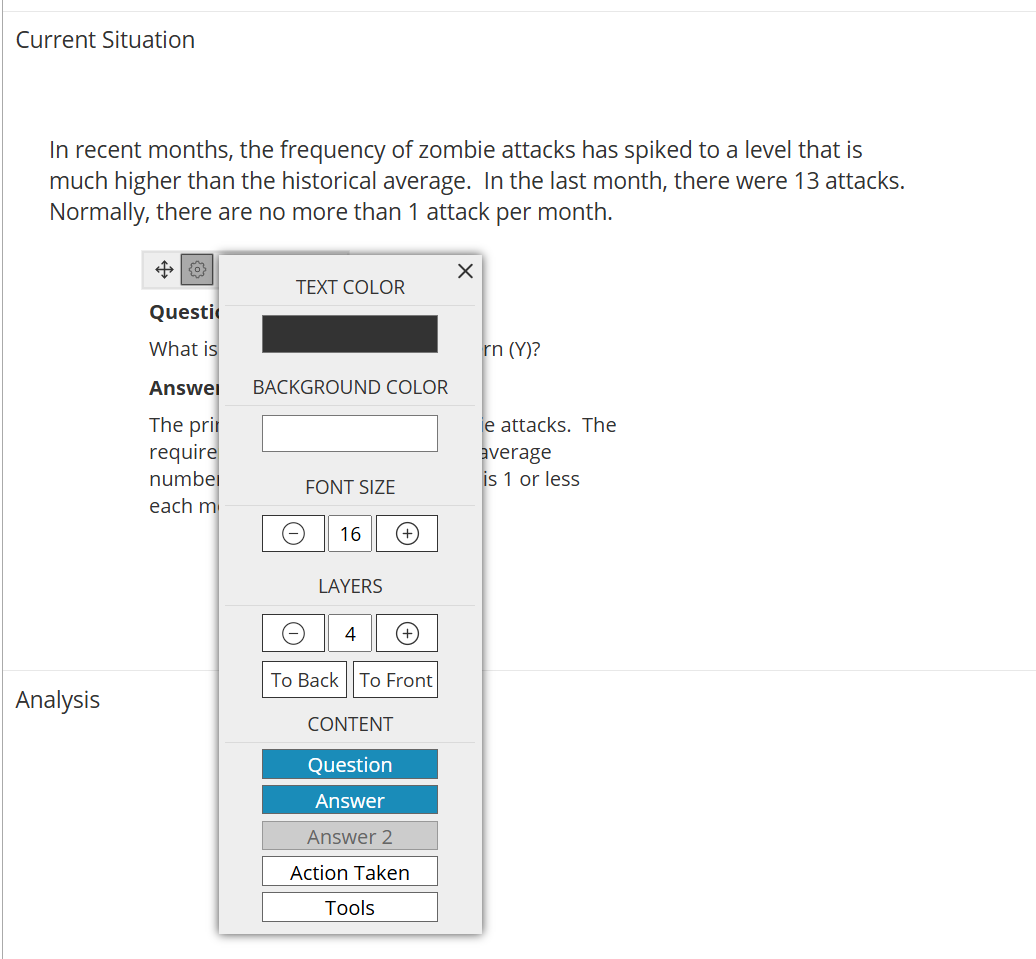
In addition to the text settings from earlier, you can also specify what content is displayed for questions and answer elements. In this case, you could include any follow-up questions and their responses.
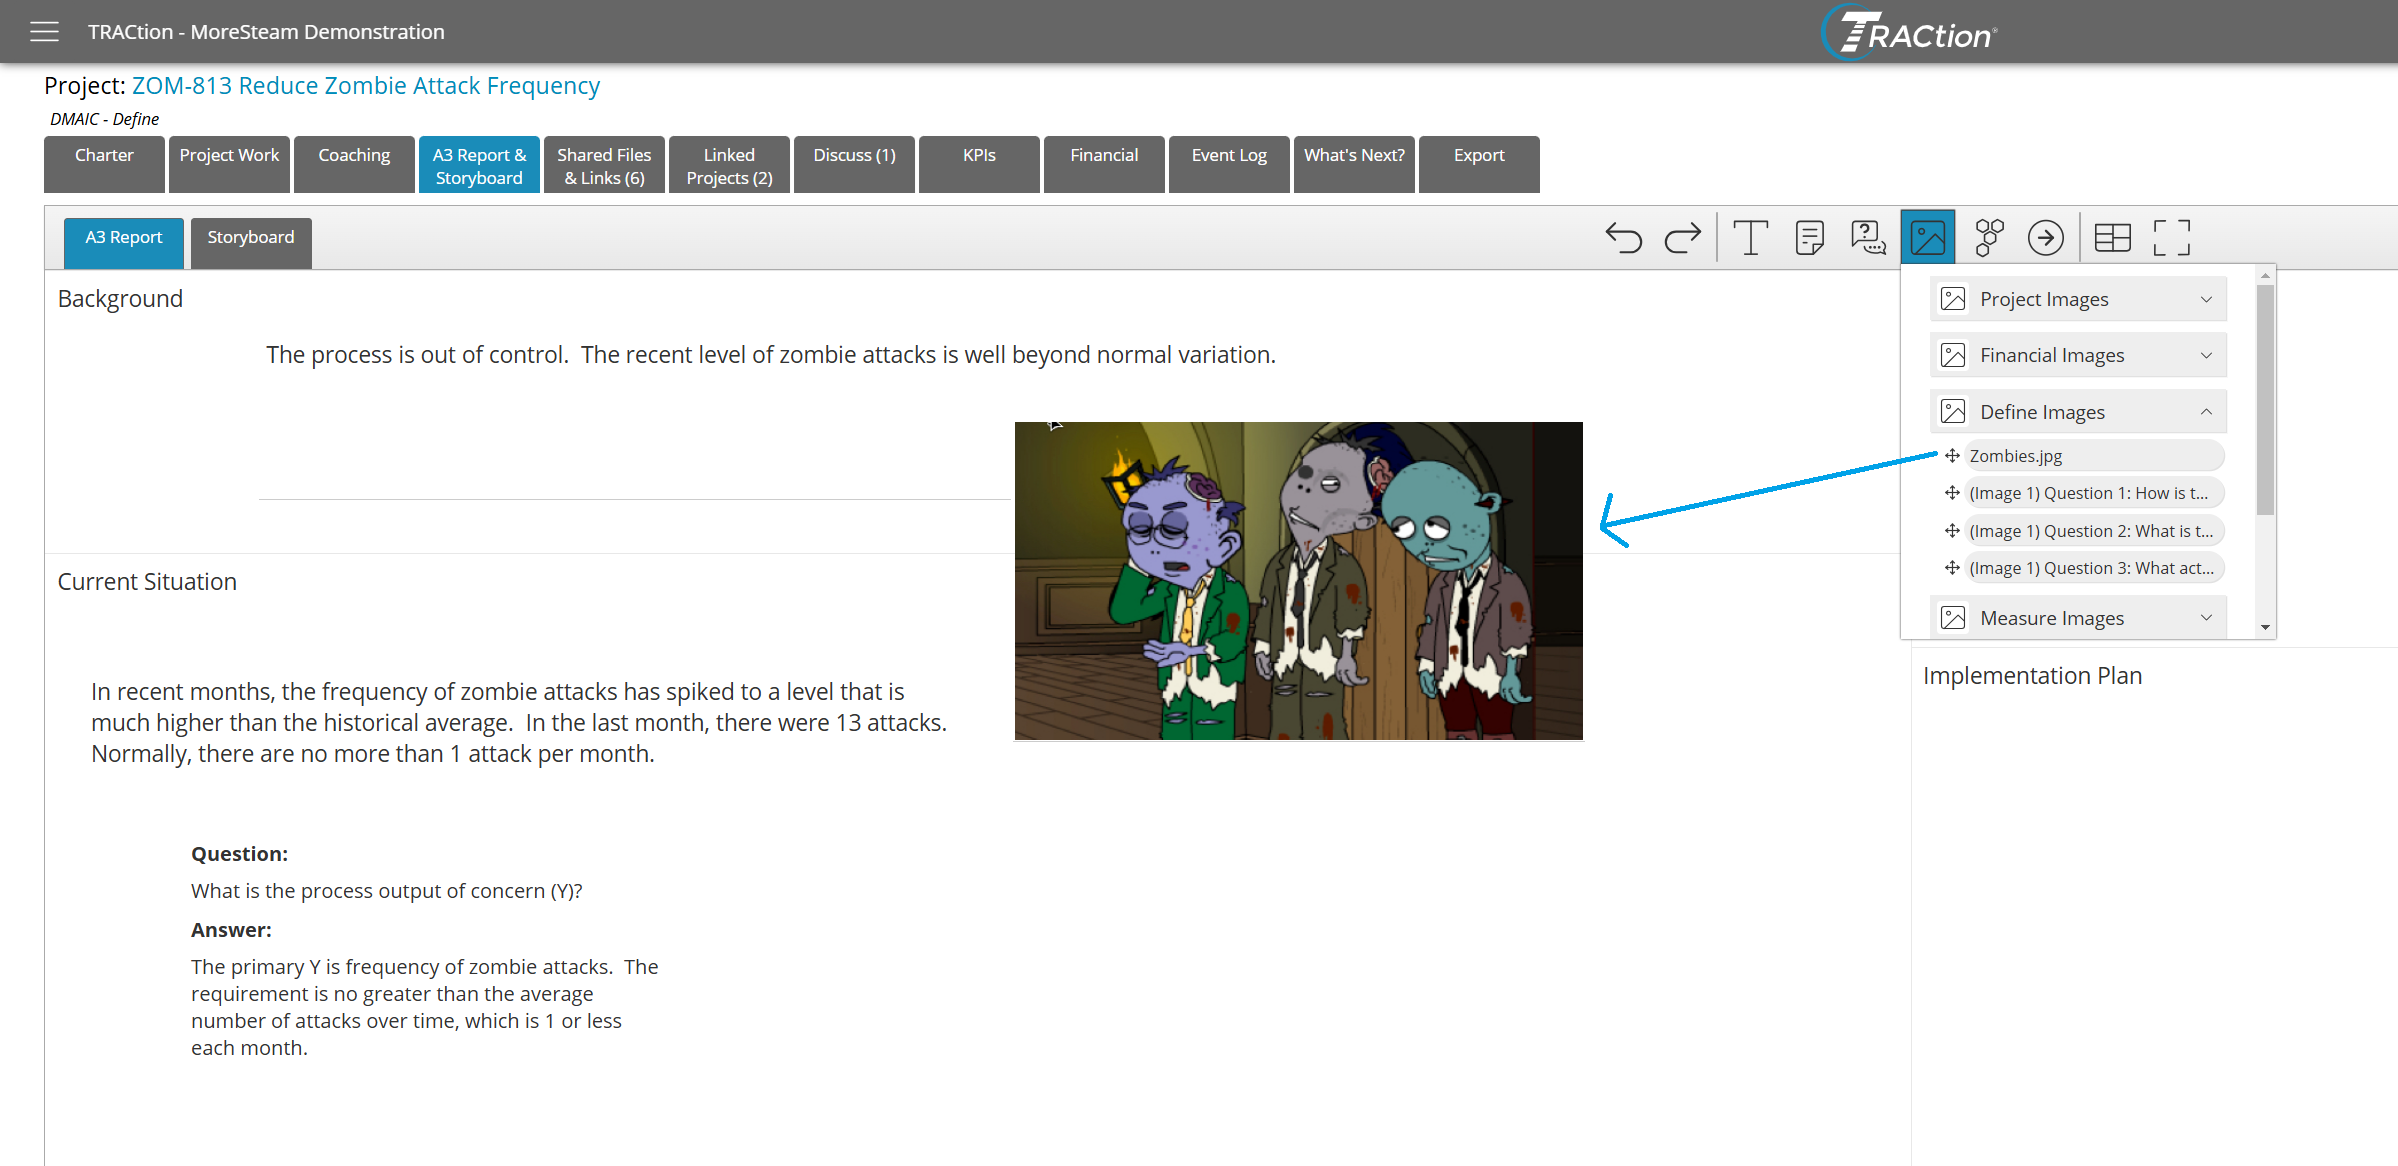
To bring in images uploaded to the project, you can click the image icon and drag any desired image to the A3. The images that can be selected are pulled from images added to project question responses as well as images uploaded to the project’s Shared Files tab. Double clicking an image on an A3 will expand the image.
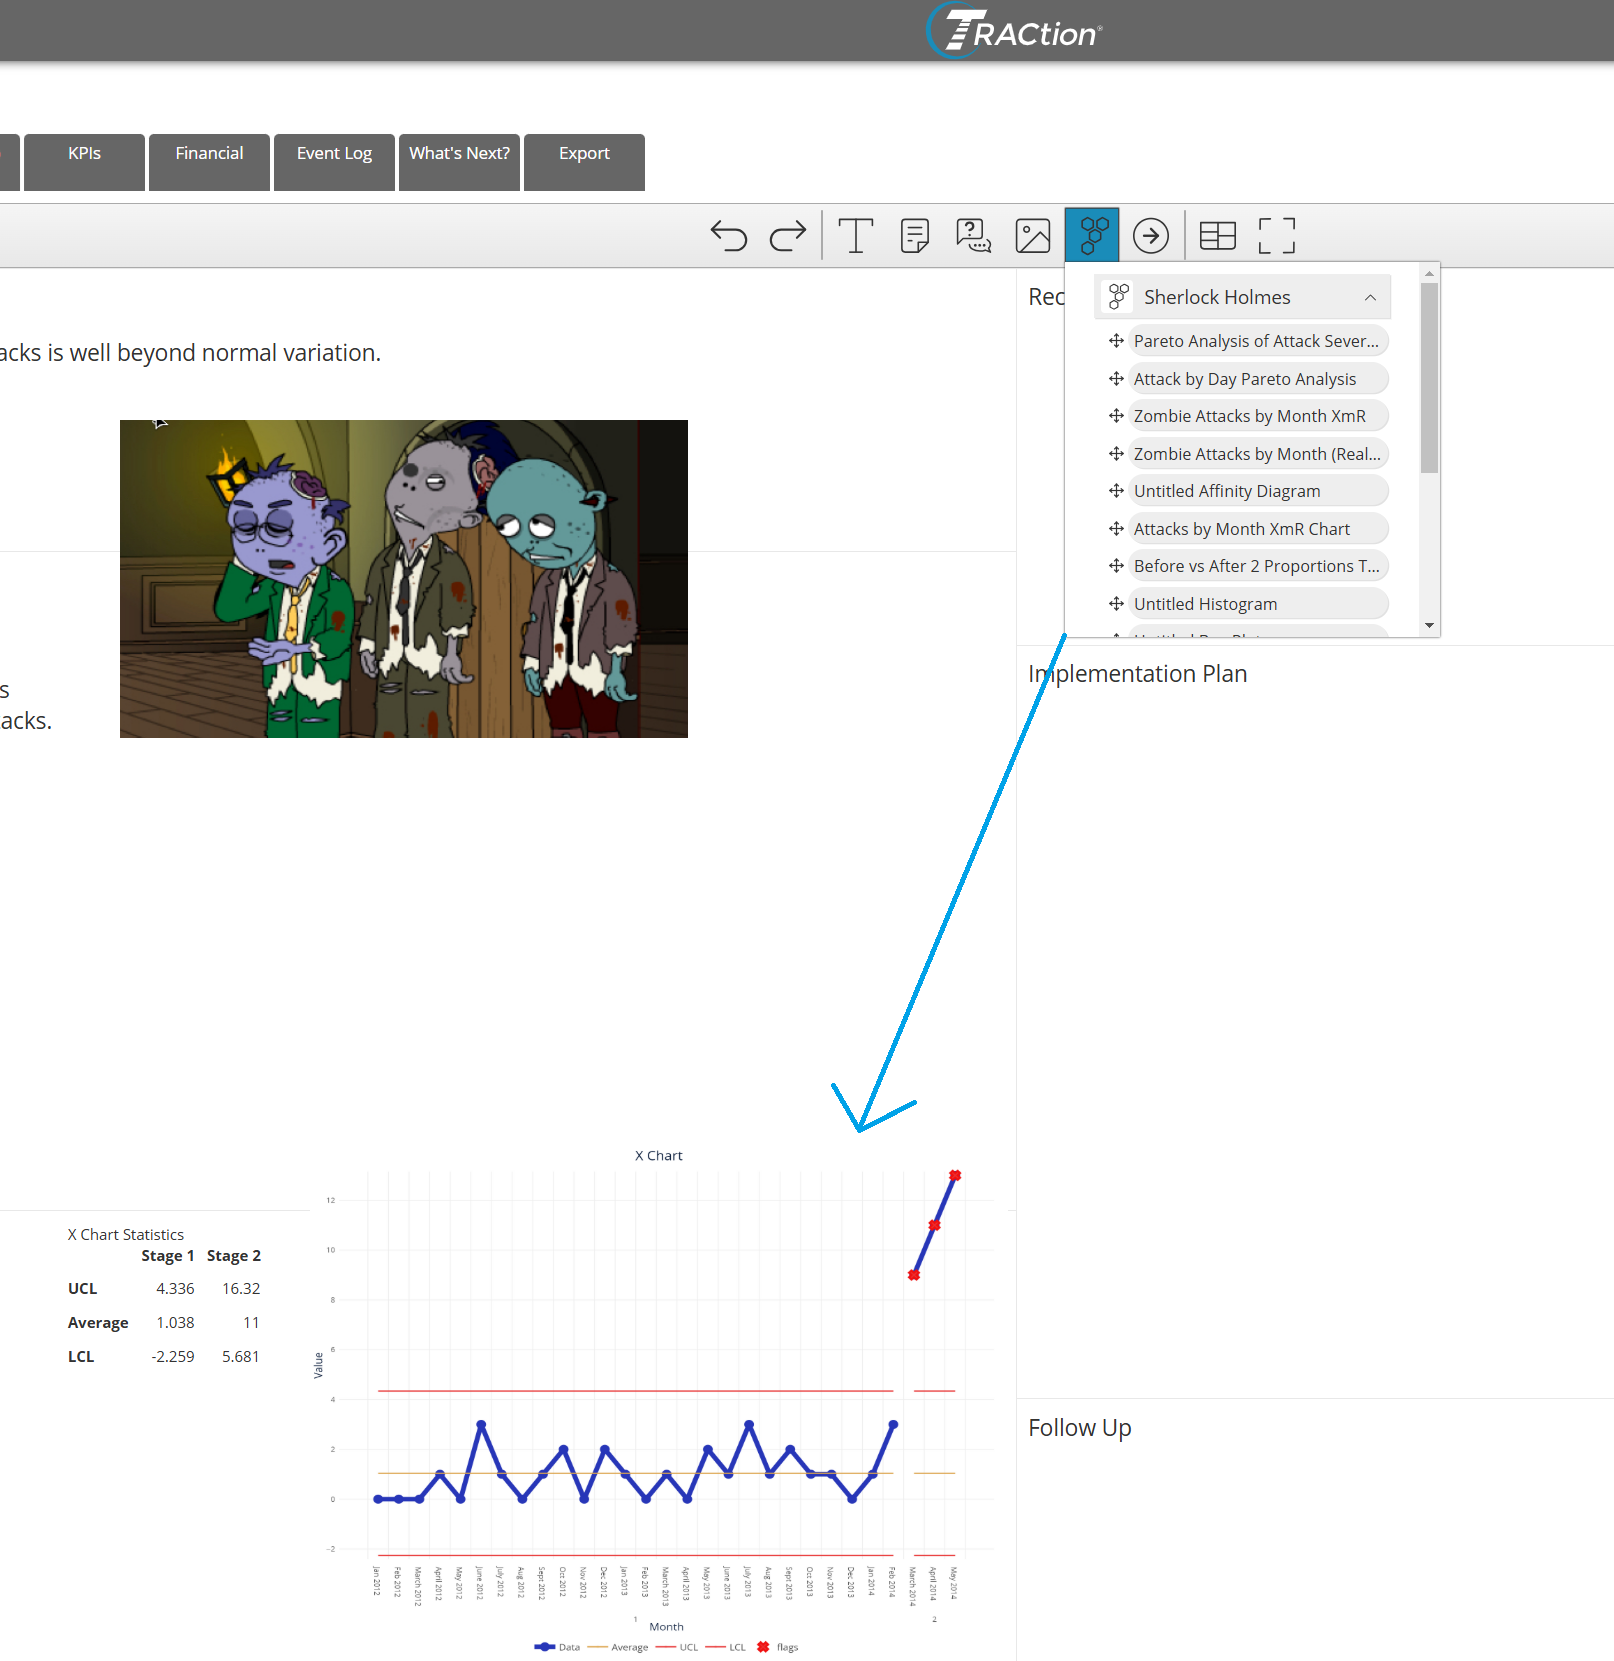
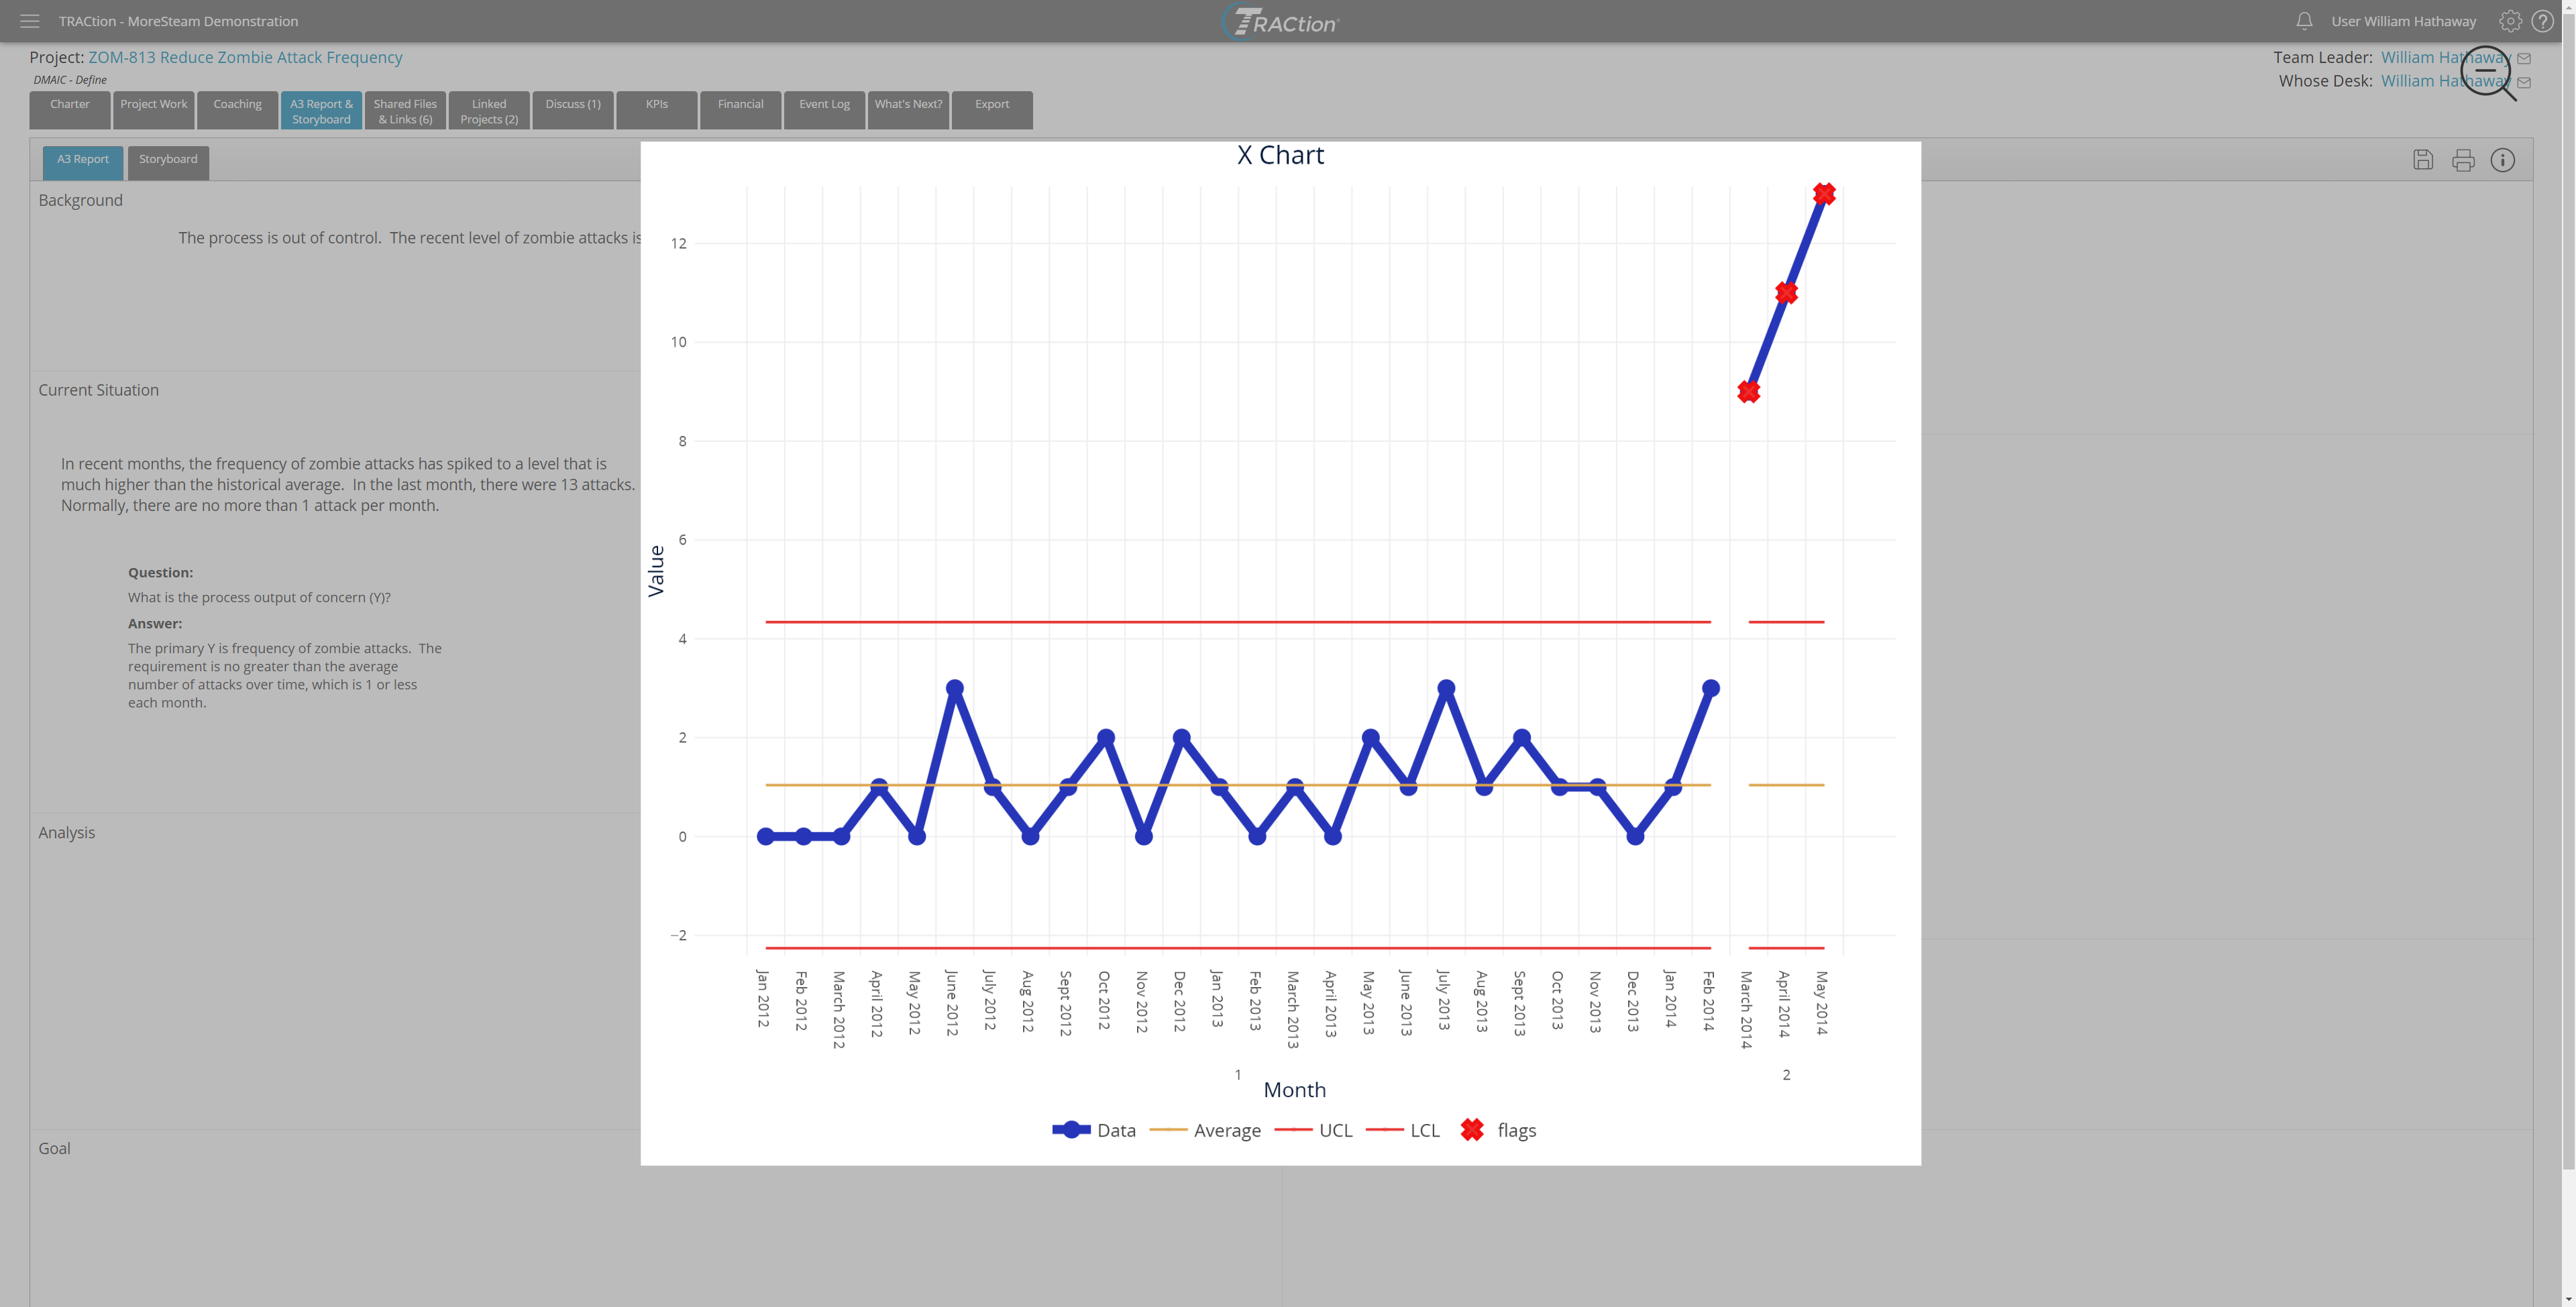
If you have any EngineRoom projects linked to your project, you can also drag EngineRoom studies onto the A3 by opening the EngineRoom menu and dragging any desired studies to the A3. Once they have been placed on the A3, you can remove any tables or charts by hovering over the elements and clicking the delete icon.
Double clicking the EngineRoom study will bring up the full-size version of the study for easier review.
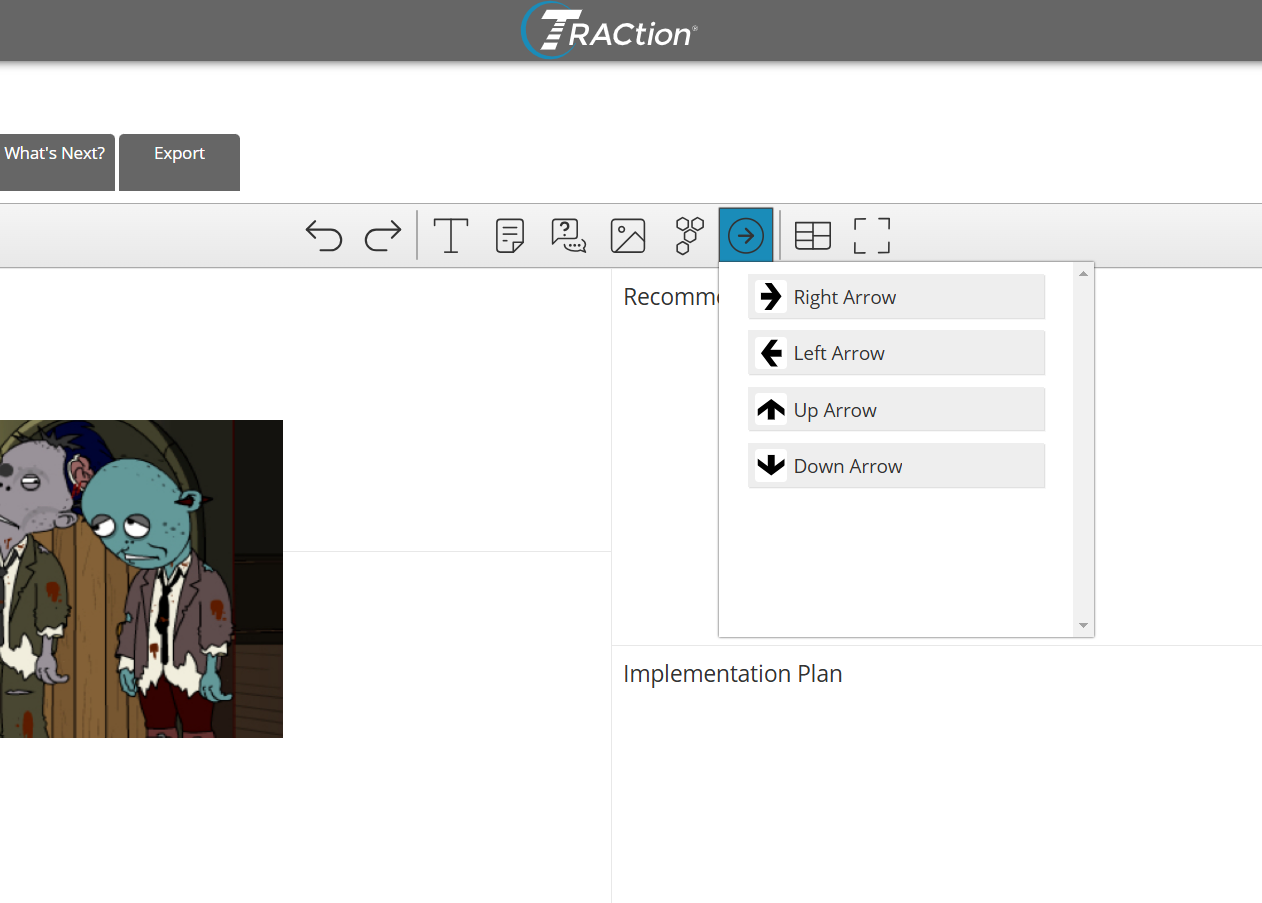
To show relationships between elements, you can also drag arrows on to the A3 using the arrow icon. The arrows can be stretched and moved to adjust.
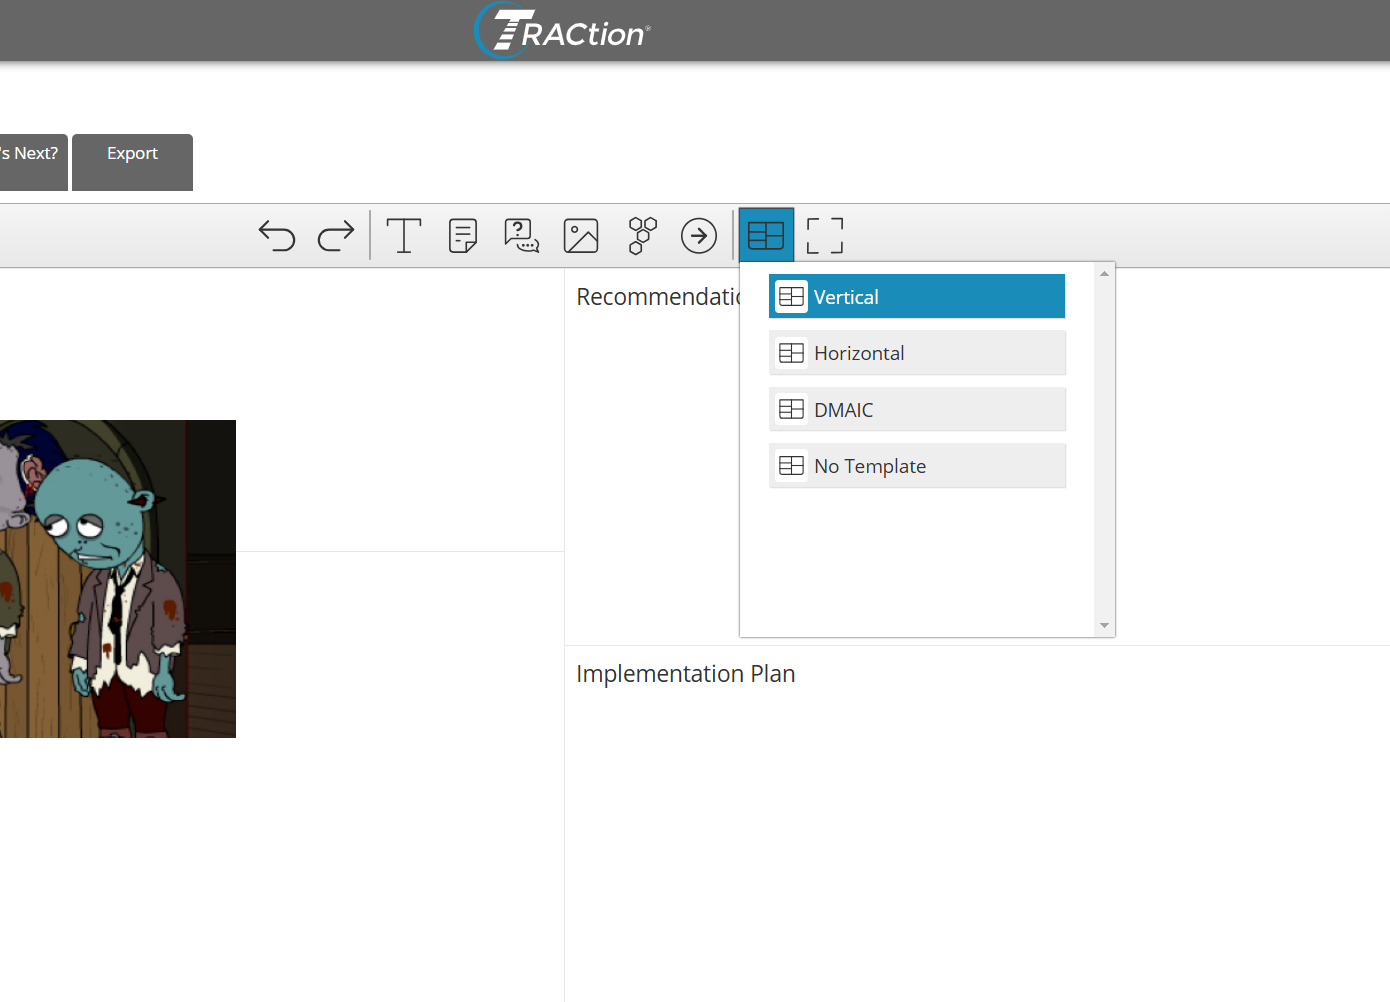
By default, A3s use a template to create grids for where to place elements from your projects. If you wish to change the view, you can open the templates menu and select one of the available options. If you wish to start from a completely blank template, select “No Template”.
Additional Functionality
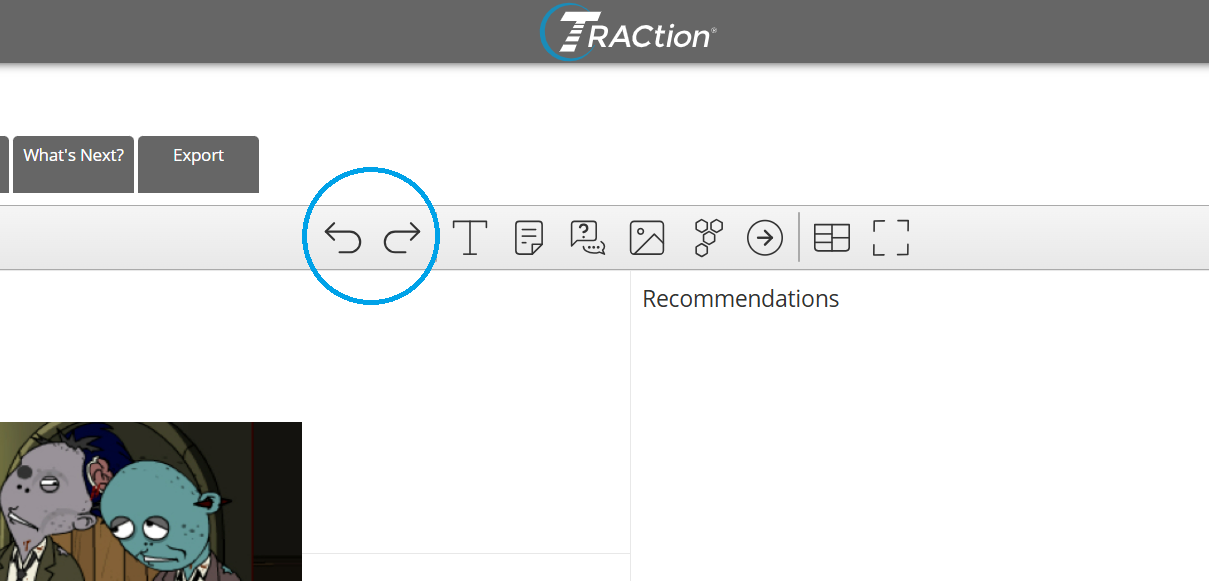
To Undo or Redo an action, click the Undo and Redo buttons on the left side of the toolbar.
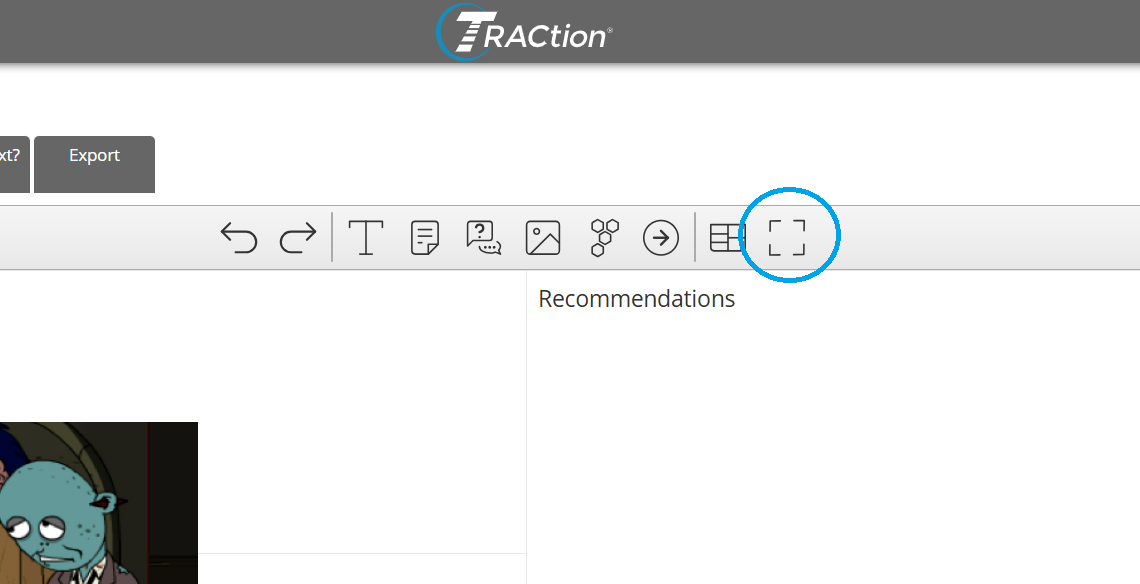
To open the A3 in fullscreen mode, click the Fullscreen button.
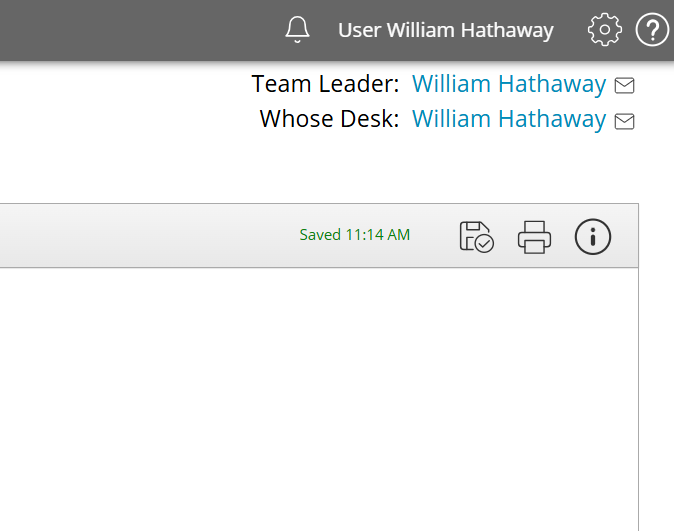
To save your changes, click the floppy disc icon in the top right of the screen. A checkmark will be visible if it has saved correctly with the save time showing up to its left.
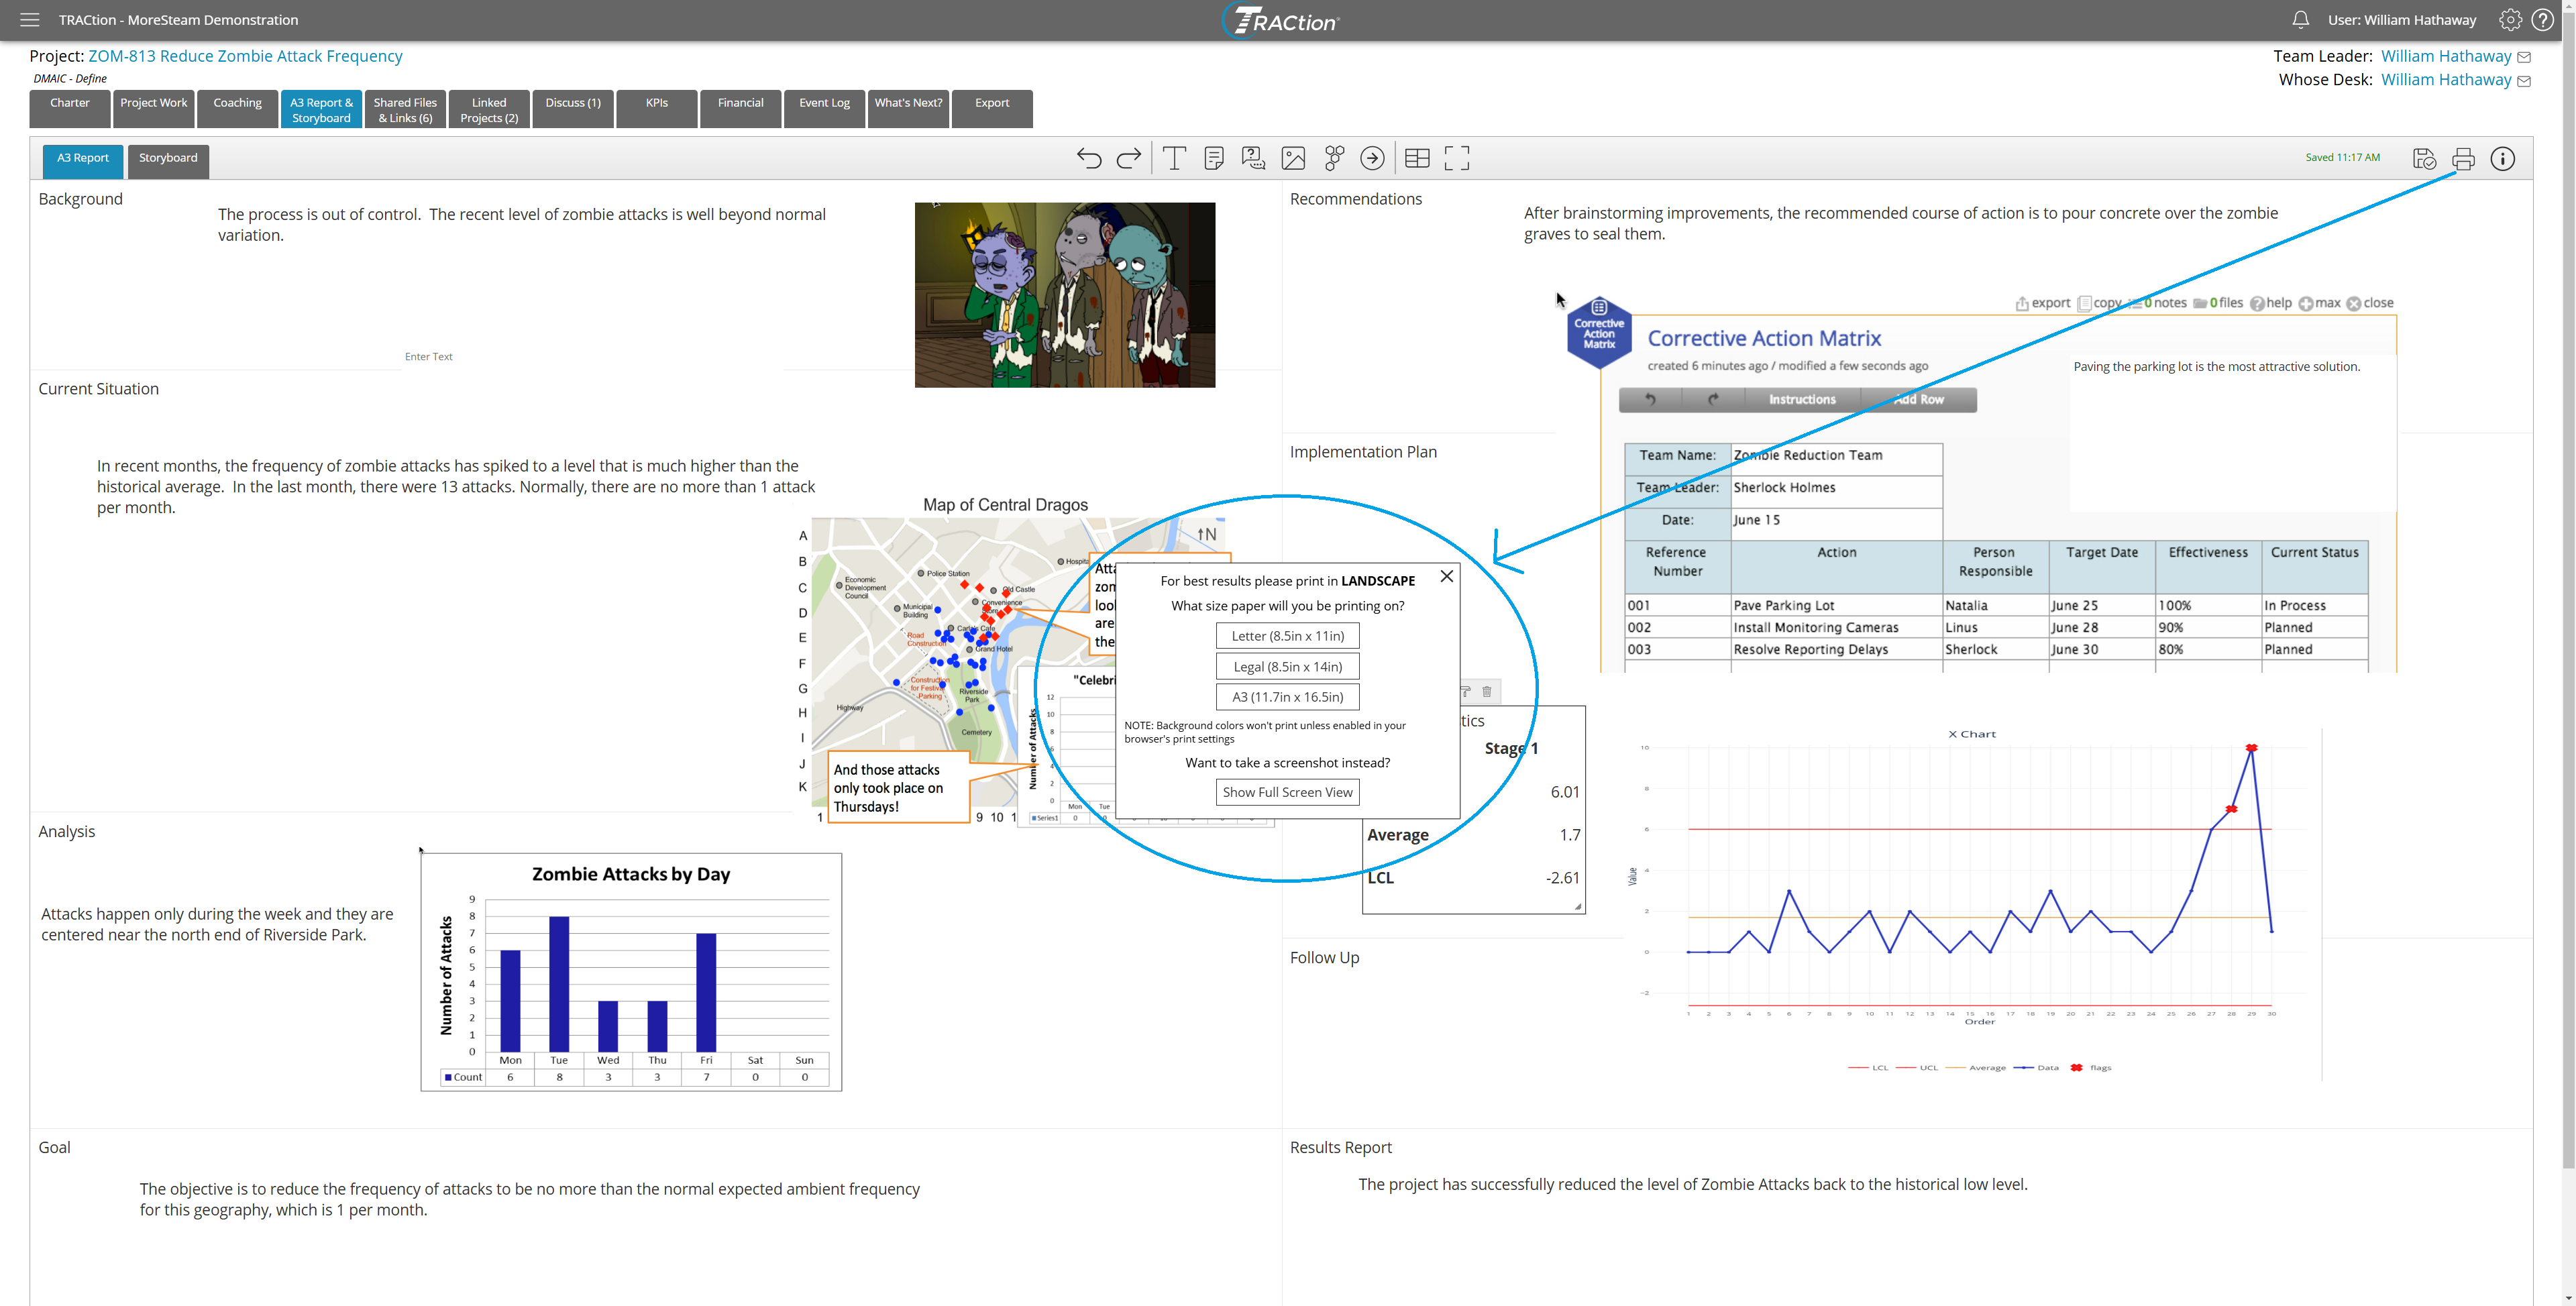
To print the A3 or save it as a PDF, click the print icon in the top right. From there, choose a size of paper you’d like to print or save the report as.
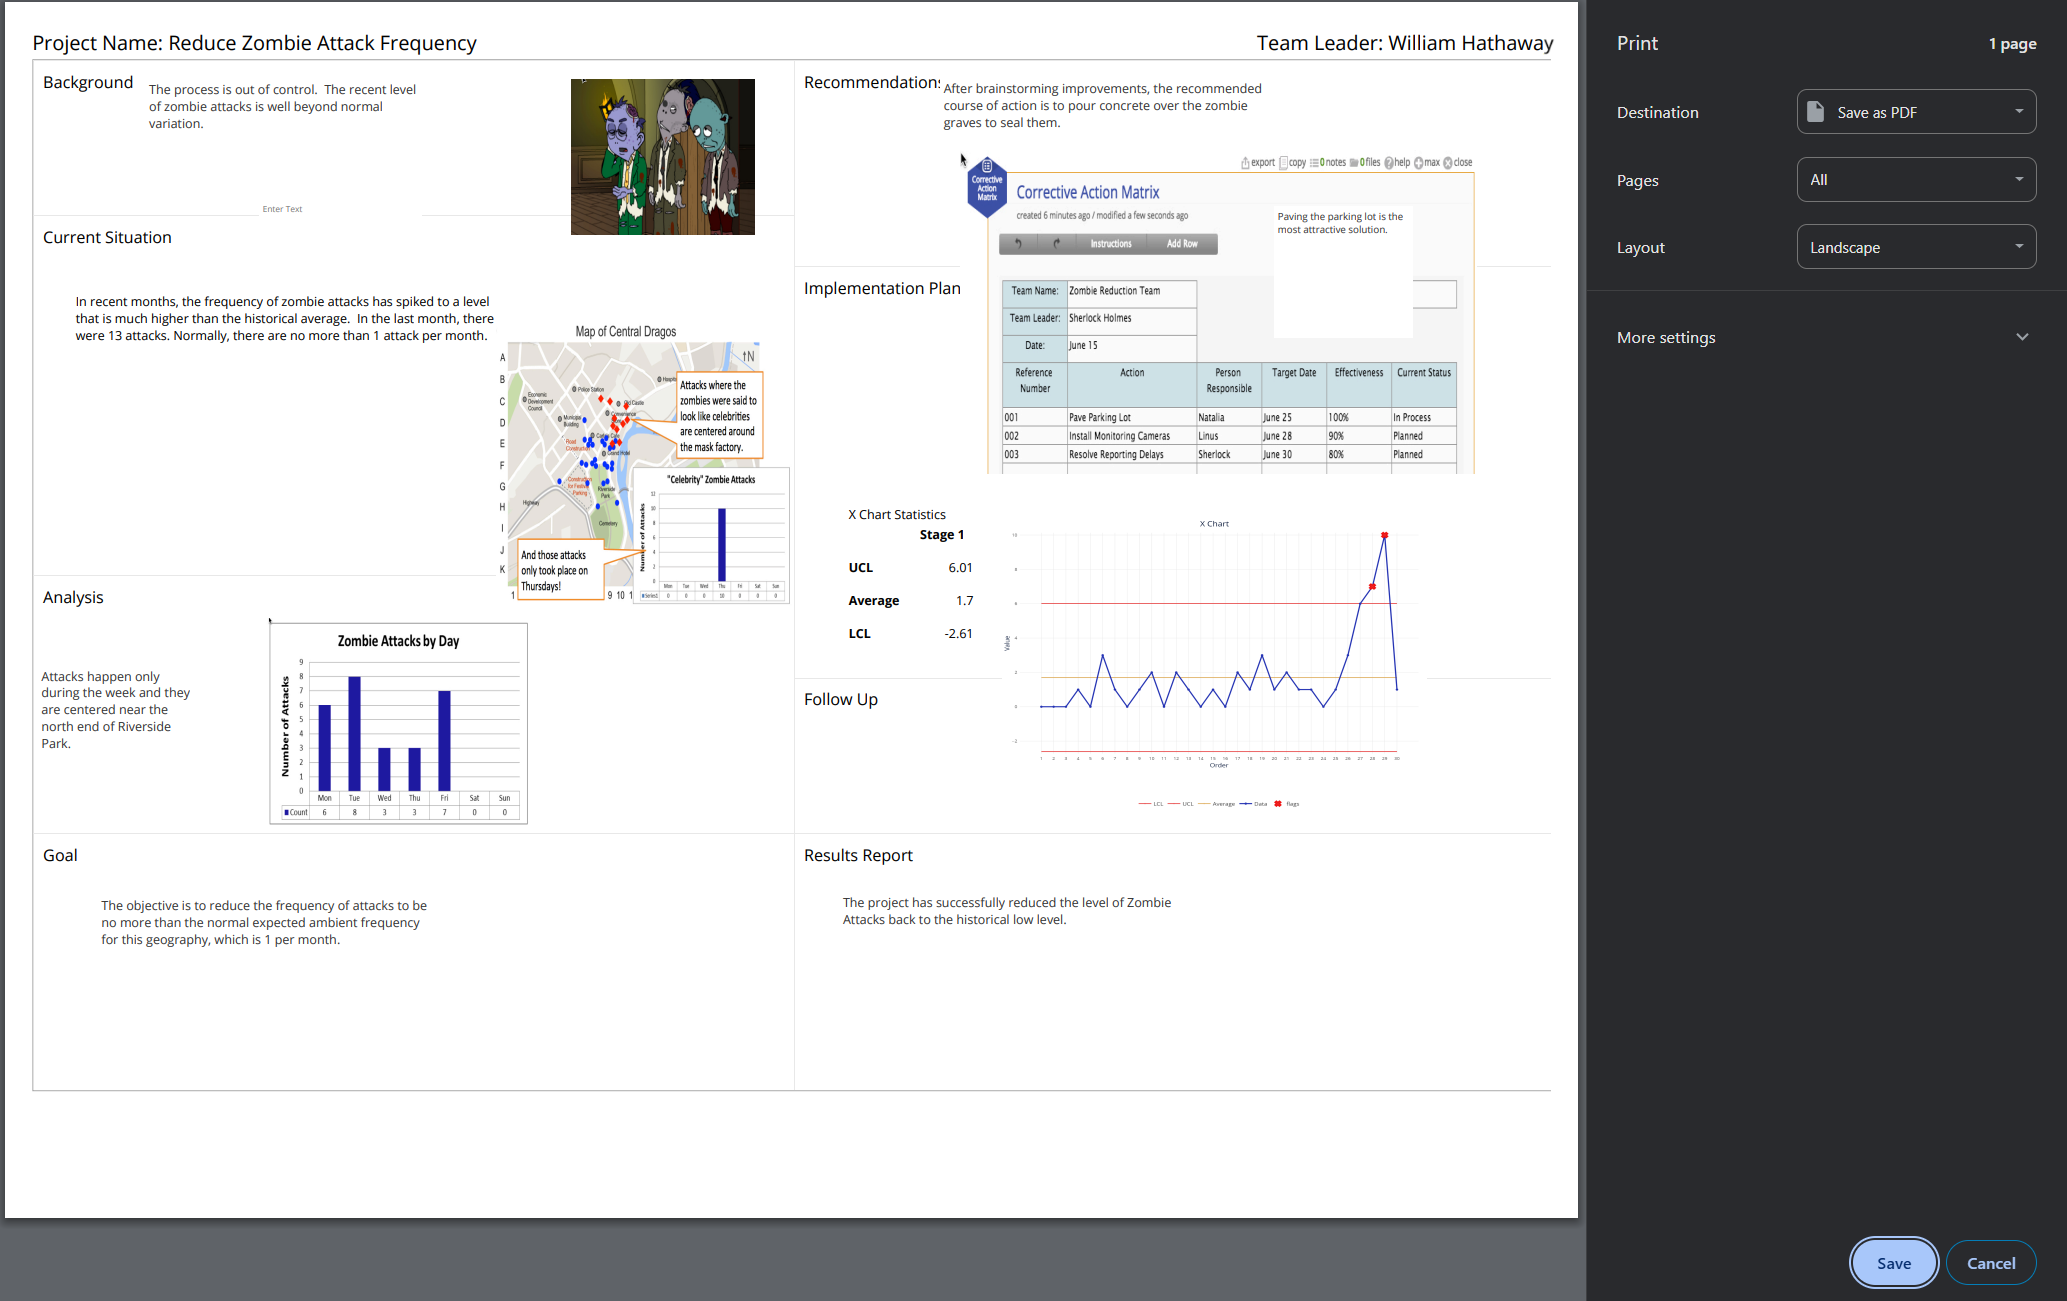
In the pop-up window, you can make adjustments to be able to print the A3 report. If you would rather save the report as a PDF, update the report’s destination to be “Save as PDF” instead of a printer.
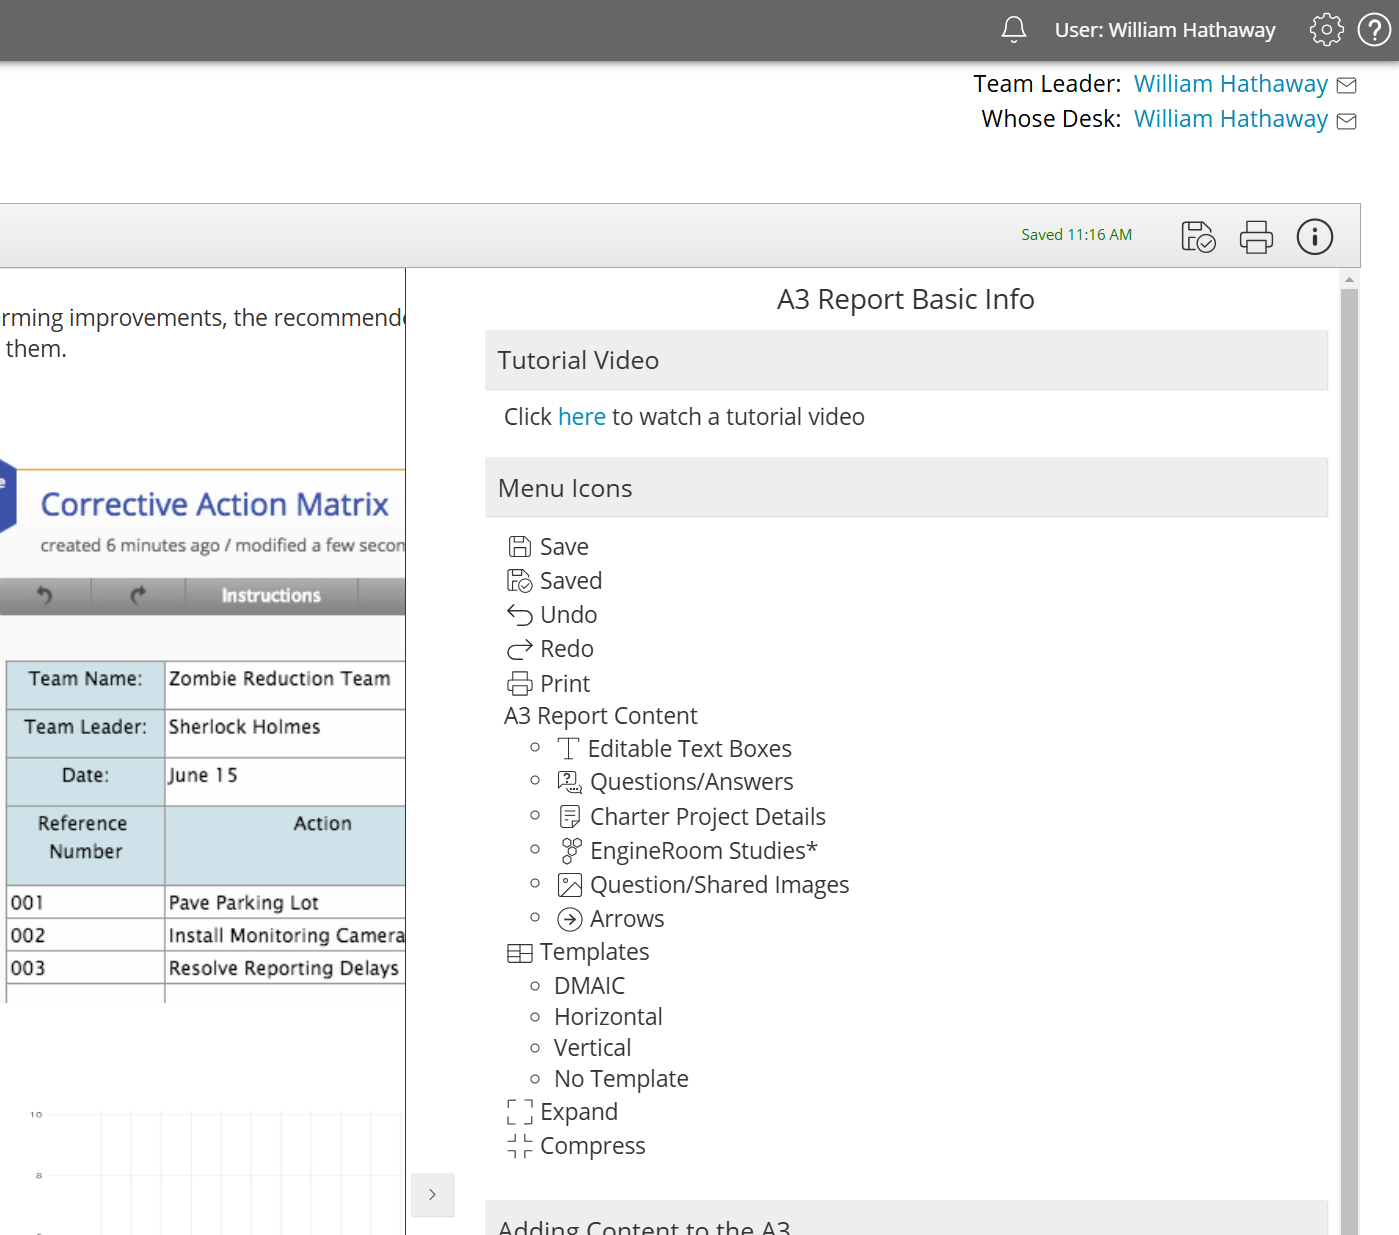
If you’d like to view additional information or guides within the tool, clicking the info icon in the top right will pop up an in-product explanation for the features of the A3 Report.
Continue to make adjustments until the A3 contains all of your desired information!
For additional information on A3 reports, you can learn more about A3 Reports here.
Was this helpful?