Kathy's Best Wursts, The Early Days
Follow Along
Building a Basic Model
Throughout this course, we will follow the development and growth of Kathy's Best Wursts, a new food cart business. Kathy's Best Wursts started as a pushcart operation that Kathy took to local high school sporting events and county fairs. It was a simpler time, with Kathy as the only employee and traditional bratwursts – plus a range of fixings added when ordering – as the only menu item.
The first model will represent this early stage. Here are the basic process parameters that define Kathy's Best Wursts at this point:
- Customer demand averages one customer per minute. It is highly variable and appears to be exponentially distributed.
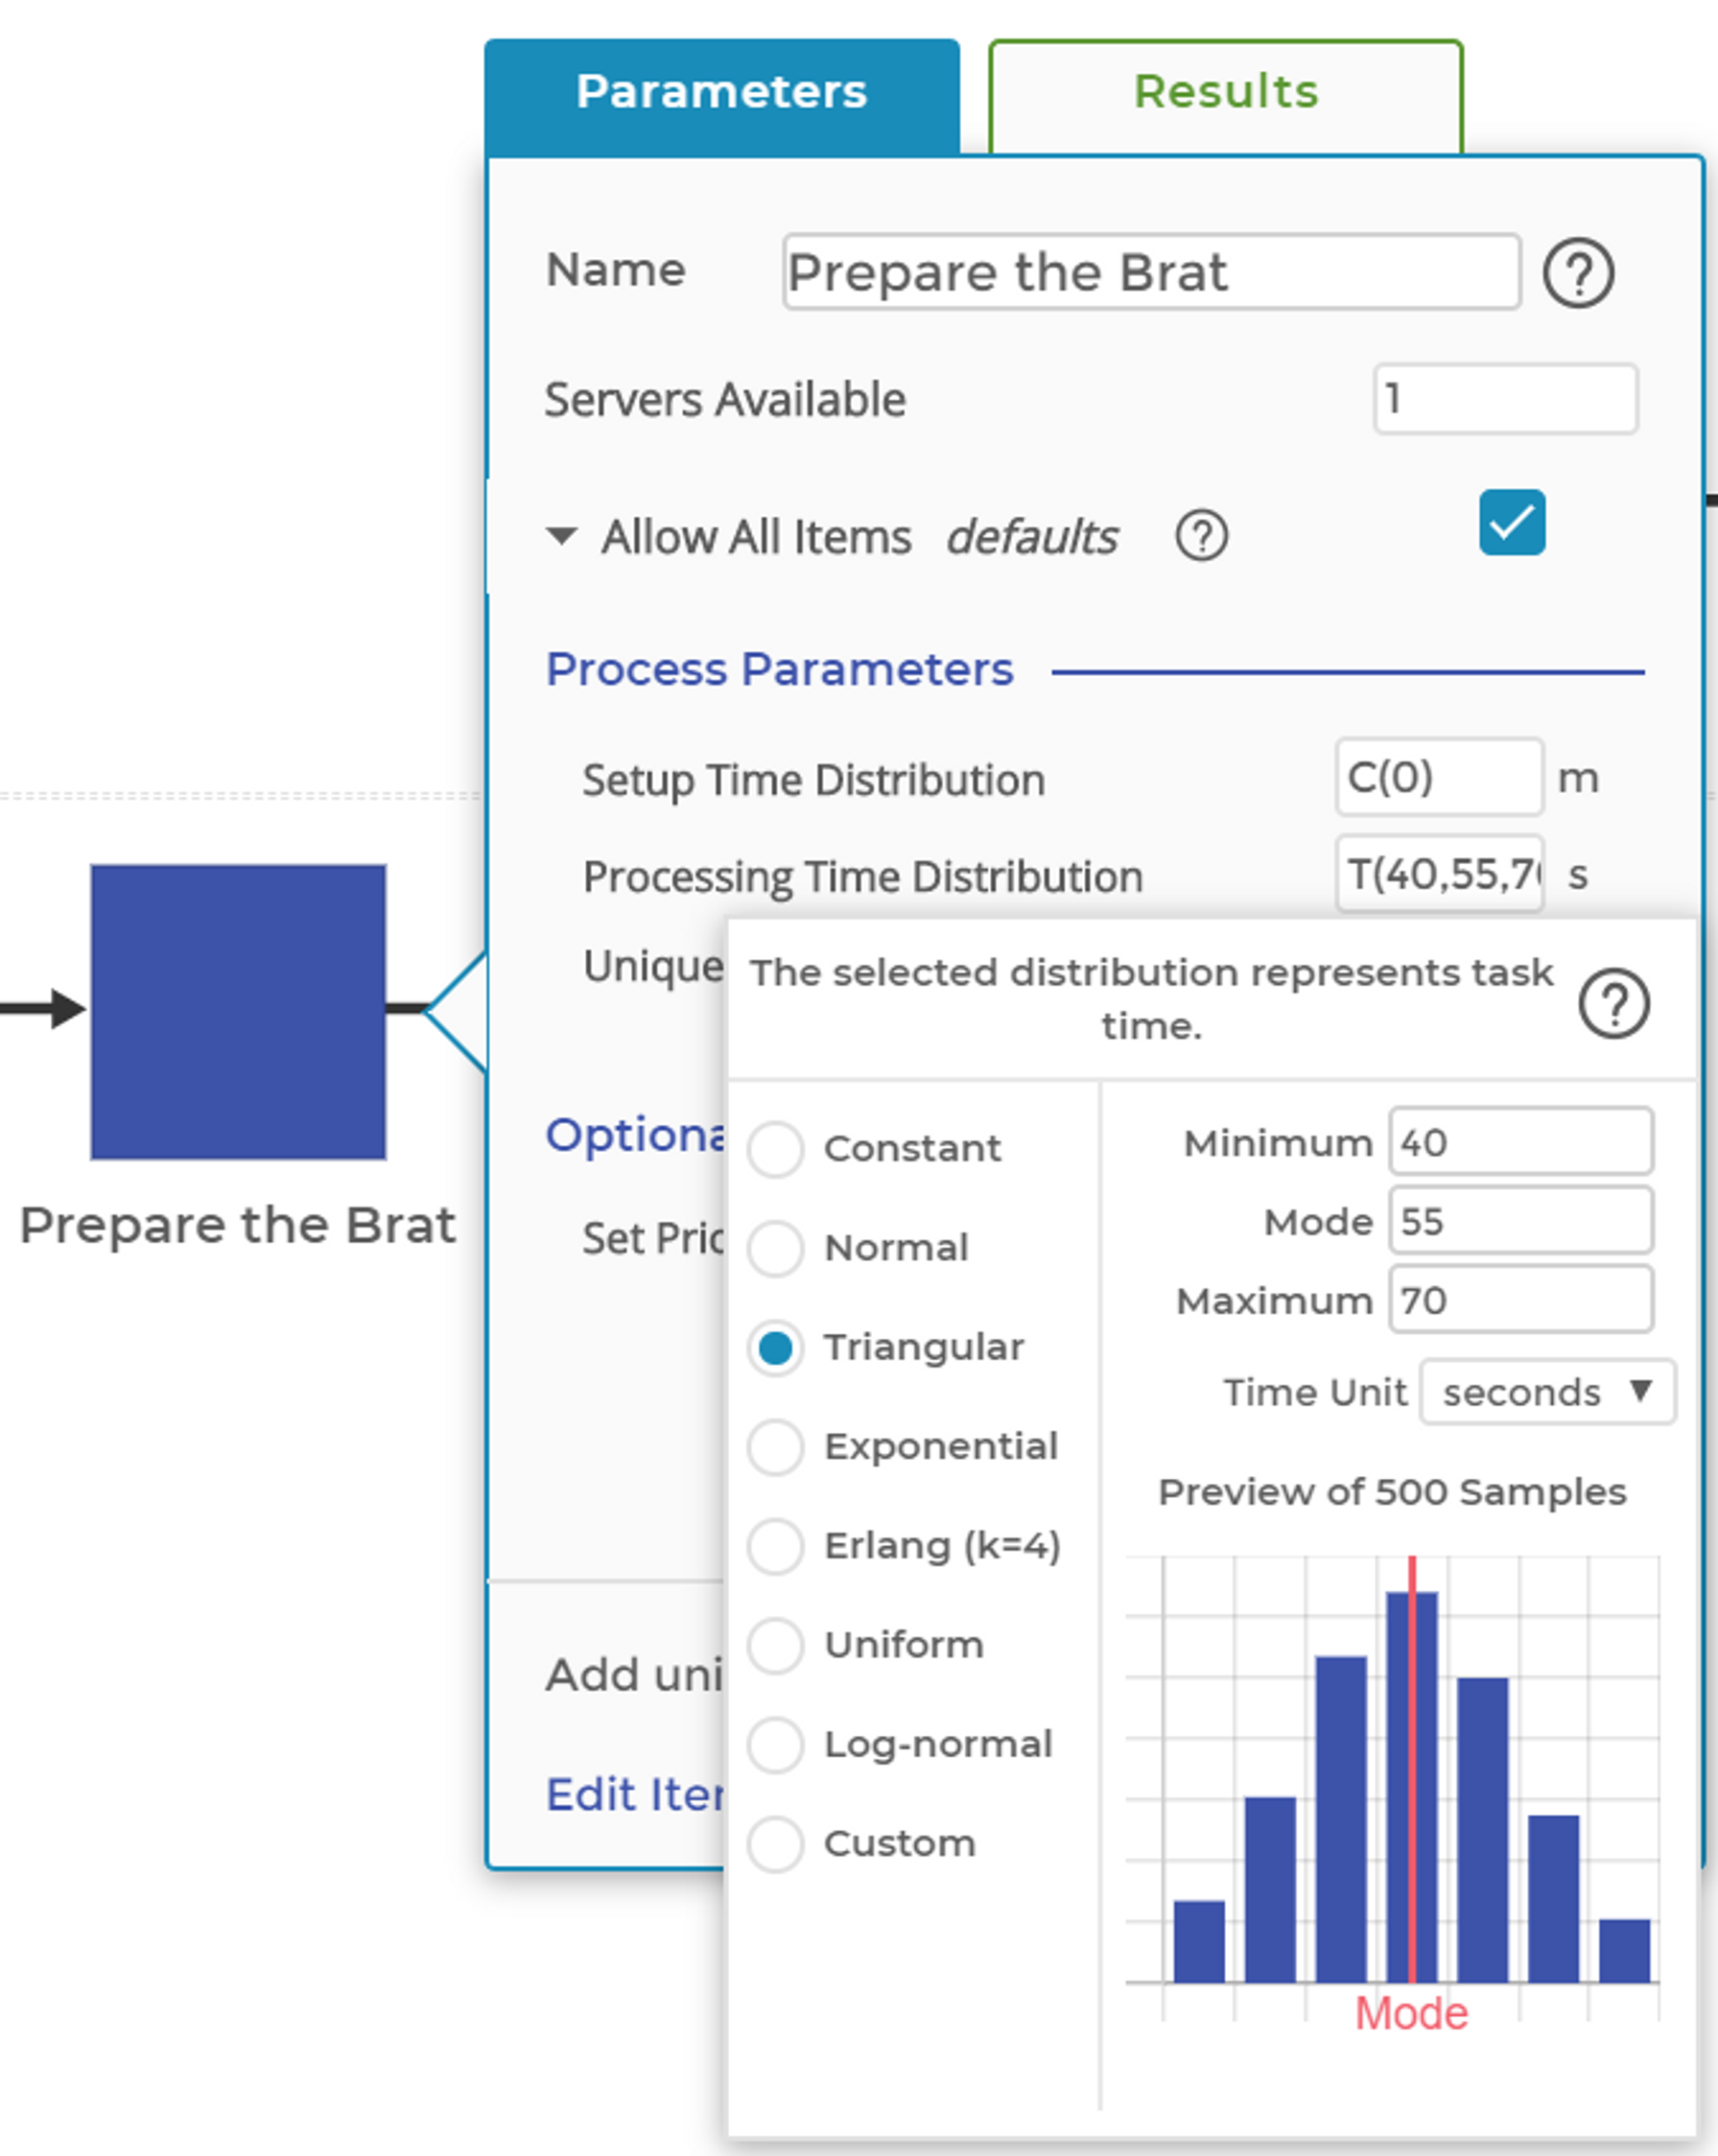
- Kathy prepares the brat, placing it in the bun and adding the requested fixings. This task takes her 55 seconds on average but can range between 40 and 70 seconds, depending on the number of fixings. The task time is well modeled by the triangular distribution, with mode = 55, min = 40, and max = 70.
- Kathy's Best Wursts is usually open for business for four hours during most events.
Start by building the basic model shown in the picture below:
Drag each of the blocks needed from the left-hand toolbar to the white workspace in the middle of the screen.
Making Connections
To connect one block to the next, hover your mouse above the block and you will see small blue circles appear. These are your connection points. Move your mouse to hover over one of these points and a larger blue shadow circle will appear around the smaller blue circle. At this point, you can click and drag the connection line toward the shape you want to connect to. When you arrive at the target block, the little blue circles will appear. At this point, move your mouse to "land" on one of the target circles. When the larger blue shadow circle appears, release your mouse and the connection is made.
Changing Parameters
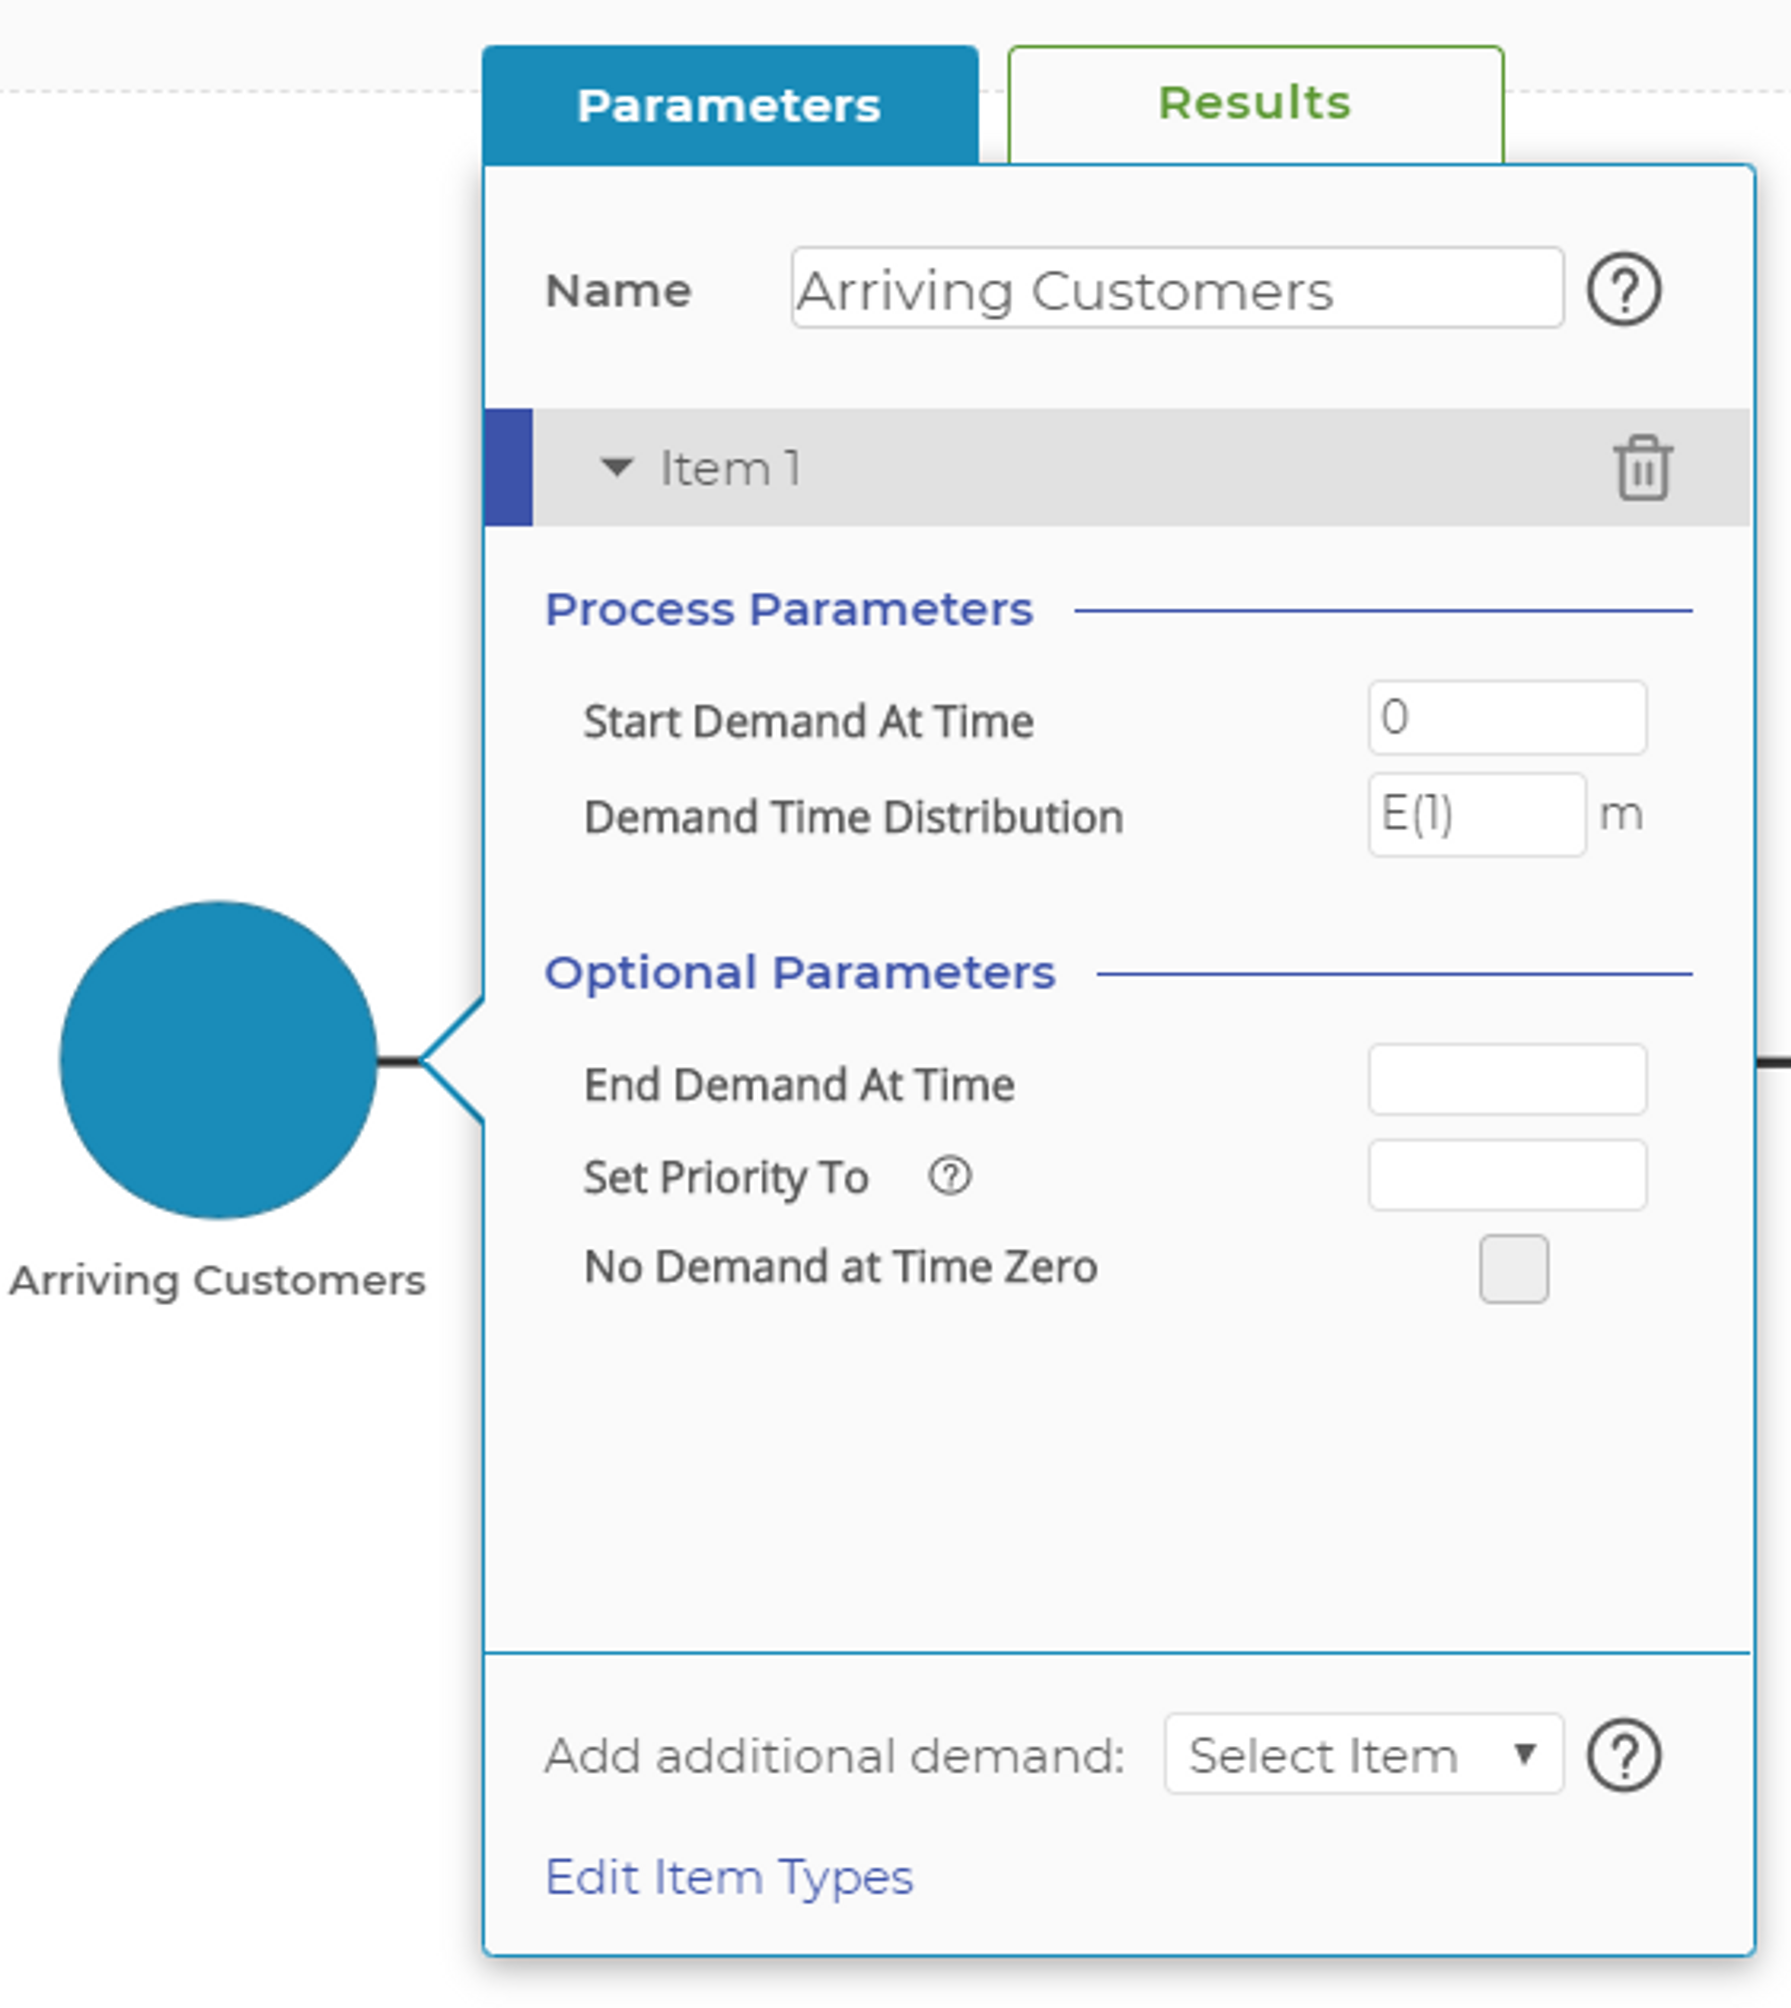
After you have dragged on the blocks and made the needed connections, you will need to enter the demand and processing information into the Demand and Activity blocks. Start with the Demand block: Double-click to open the parameters window (shown in the image below), then click on the Demand Time Distribution input. This will show C(1) by default, indicating a Constant distribution. (Learn more about distributions) Change the default Constant distribution to Exponential distribution, leaving the default of 1 minute for the mean. While in this block, rename it "Arriving Customers." You may click anywhere outside of the dialog box to close it – remember, everything in Process Playground saves automatically as you go.
Next, double-click the Activity block. In the dialog box, enter the processing time distribution as listed below. The default again will be C(1); change that to a Triangular distribution. Note: The time unit has been changed from minutes to seconds. For Kathy's task time, seconds make more sense than minutes to describe her performance. Change the name of the block to "Prepare The Brat" while you're here.
When finished, you can change the name of the Queue block to "Waiting Line" and the name of the Exit block to "Happy Customers."
Congratulations! You've built your first simulation model in Process Playground. This is a simple "push" model, referring to the concept that customers (or orders) are pushed into the process, regardless of the state of the process. Now it's time to run the model and examine some results.
Was this helpful?


