Running the Model
To run a simulation model in Process Playground, click on the green "Run" button in the toolbar (third from the left).
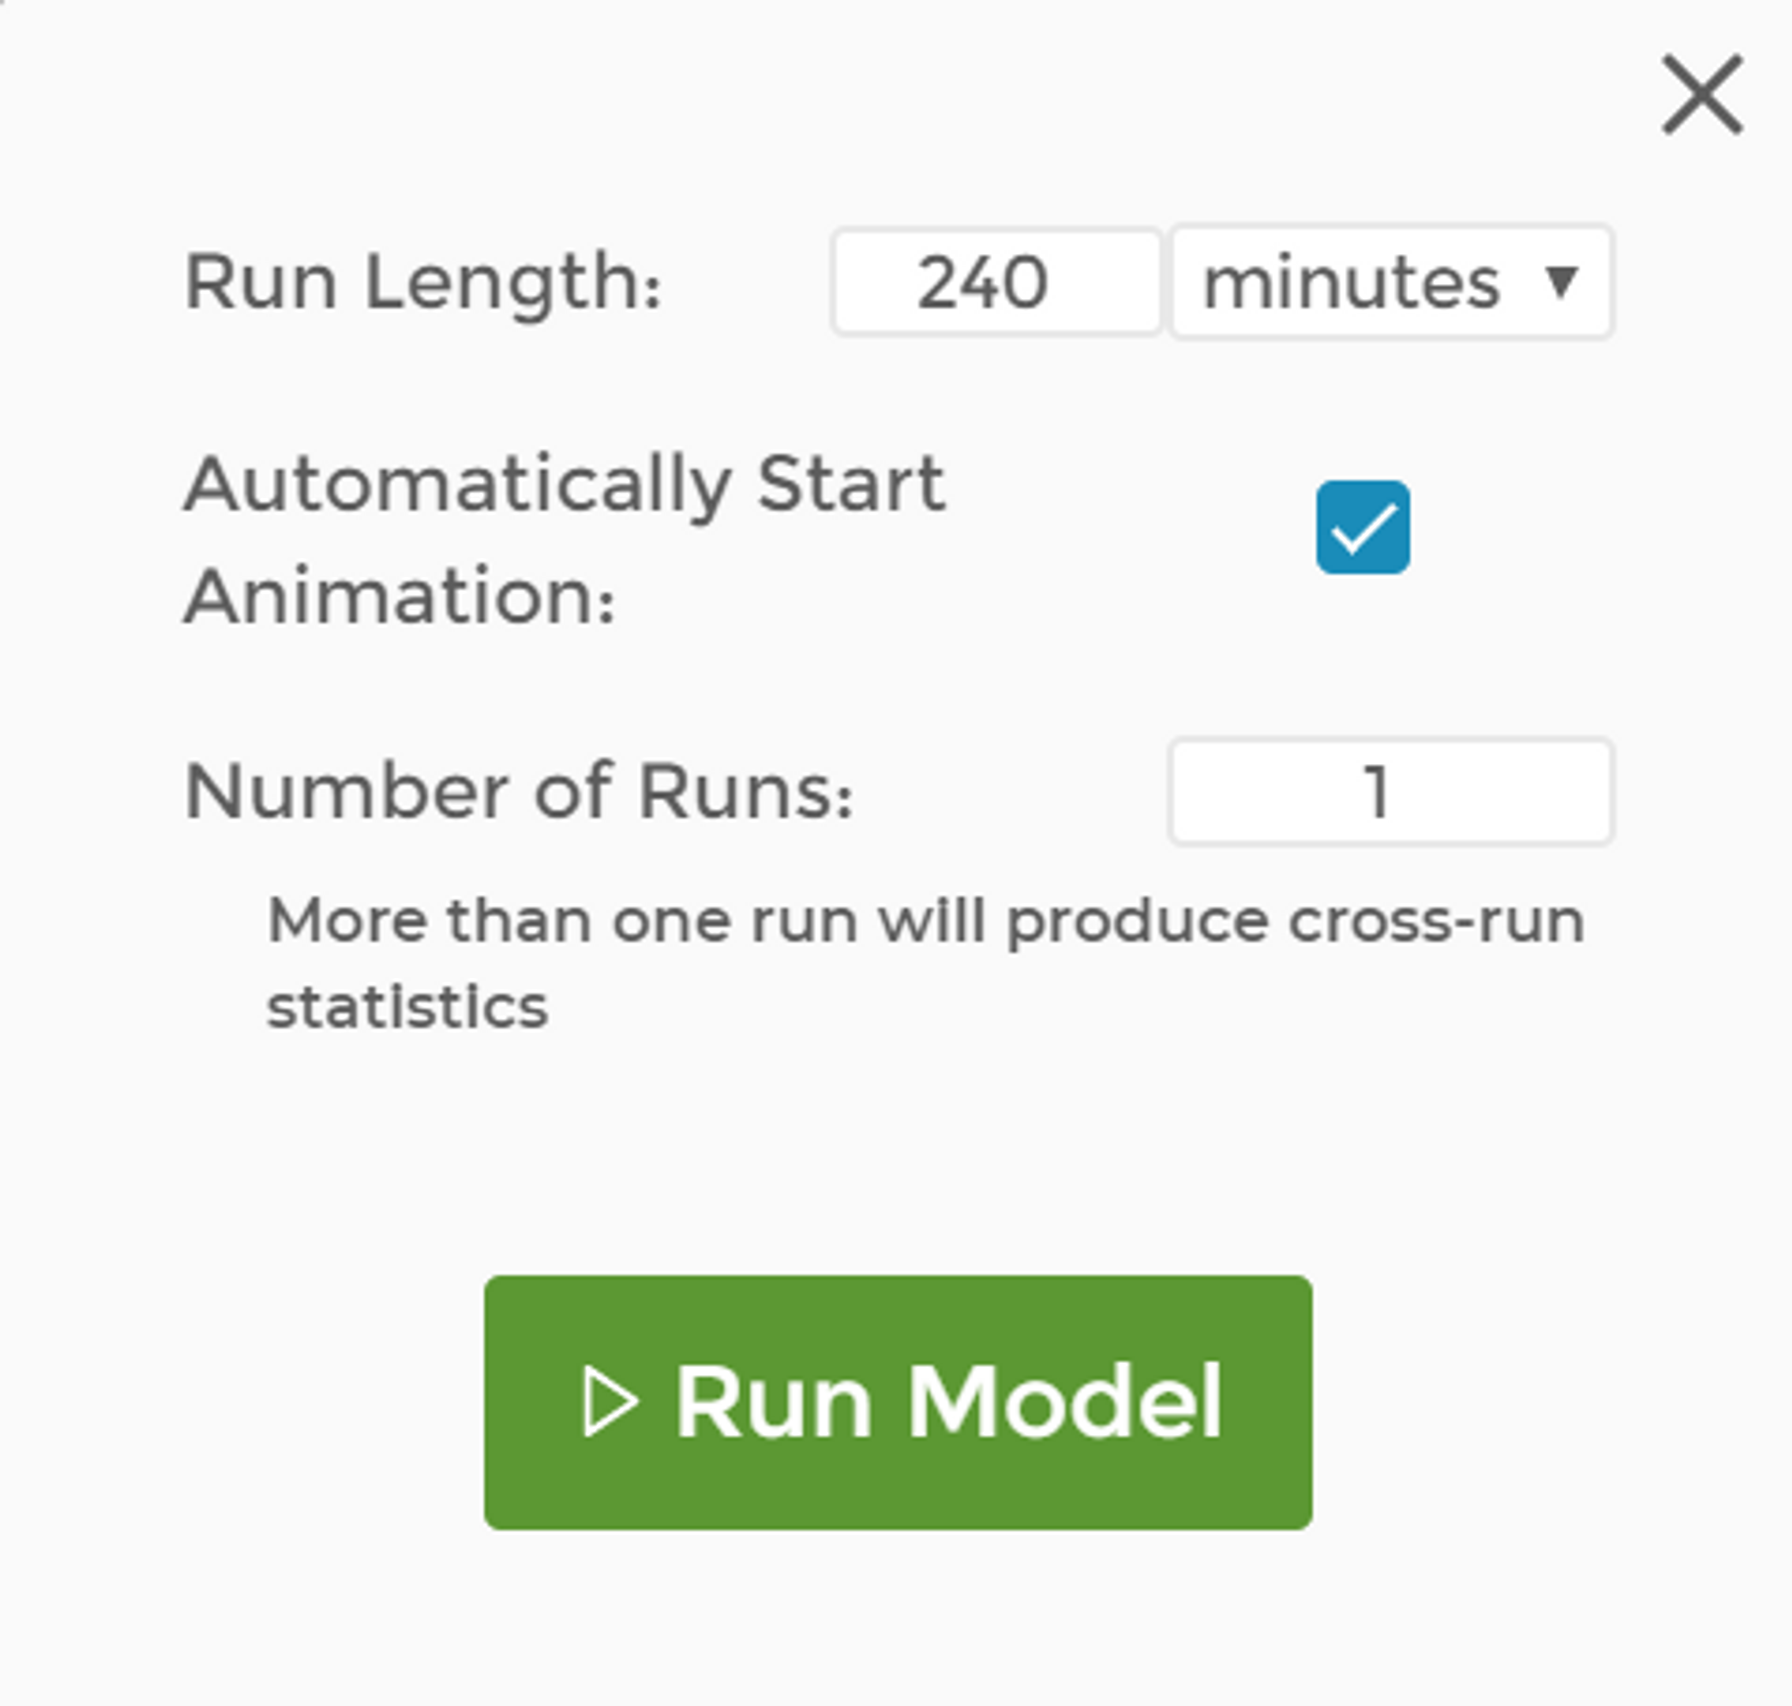
The "Run" dialog box will open.
Run Dialog Options
You must make a few decisions about your model run:
- Number of Runs: While you're building and debugging your model, a single run is fine. However, when it comes time to evaluate the steady-state capability of your process, you will need to run more runs, typically 15 to 30. For multiple runs, Process Playground will return both individual-run and cross-run statistics. Cross-run statistics are the most useful because they show:
- The mean of the means across runs, sometimes called the grand mean. Just as you wouldn't be very confident estimating the average age of a group of people by just asking a single person their age, you’re taking a similar risk by drawing conclusions about your process based on watching just a single day of operations.
- The standard deviation of the mean, also called the standard error of the mean. This statistic will tell you the variation observed in the mean value, whether it is the mean utilization of an Activity block or the mean length of a queue. It is this value that you would use to construct a confidence interval around the grand mean.
- Run Length: The length of your run should represent the typical length of time for the process. In the case of Kathy's Best Wursts, she typically operates for four hours, or 240 minutes. It is important to match the run length to that of the real process so the simulation will have the same amount of time to build and relieve queue backlogs, delays, or other results the model will generate. Too short of a run may not allow the model to reach the normal, steady-state operation of your process. Too long of a run is less of an issue, except your output counts will not be comparable to the real process.
- Time Unit: Whether you run in hours, minutes, or seconds doesn't matter in Process Playground. Each block where you enter time values allows you to select whichever time unit makes the most sense for you. This selection does matter when you begin examining and interpreting the results of your simulation run because all output statistics — including queue length, total lead time (TLT), block cycle time (BCT), etc. — will be calculated and displayed using the time unit you select. If you're interested in the average wait time at Kathy's Best Wursts, you’ll probably want that number in minutes or seconds, not hours.
- Automatically Start Animation: Check this box and the animation of items moving through the model will start as soon as the run is complete. Animation is useful for debugging your model and for presentations. Once you have your model built and you're running experiments, however, you'll rarely use it.
- Run Model: Click this button to start the run(s). You may need to wait a while if you have a large model with several runs. Once the run is complete, the animation bar will appear.
Animation Bar Options
The animation bar, which appears when the run is complete, is where you can control the playback of the simulation run. On the bar, you can:
- Set Max. WIP Height: This value sets the maximum number of animation squares you'll see above each block. Once the maximum is reached, a number is displayed above the squares to indicate the count of each unique item in the block.
- Clear Run: Click to clear the run’s animation and results.
- Double Arrows, Top Right: Click these to shrink the animation bar and move it out of the way.
- Control Buttons: Play, rewind, and fast-forward.
- Speed: Alter animation playback speed.
To move back and forth through the animation, you also can click on the timeline as you would in most video players. The animation in Process Playground is a recording of the simulation run, not the live process, so you can use it to examine what happens at different points.
Was this helpful?


