
Transportation Waste
Transportation Waste. This manufacturing model demonstrates transportation's impact on a process's throughput. You can use Process Playground to compare different scenarios to understand the impact of changes.
0. There is one item in this model: Order
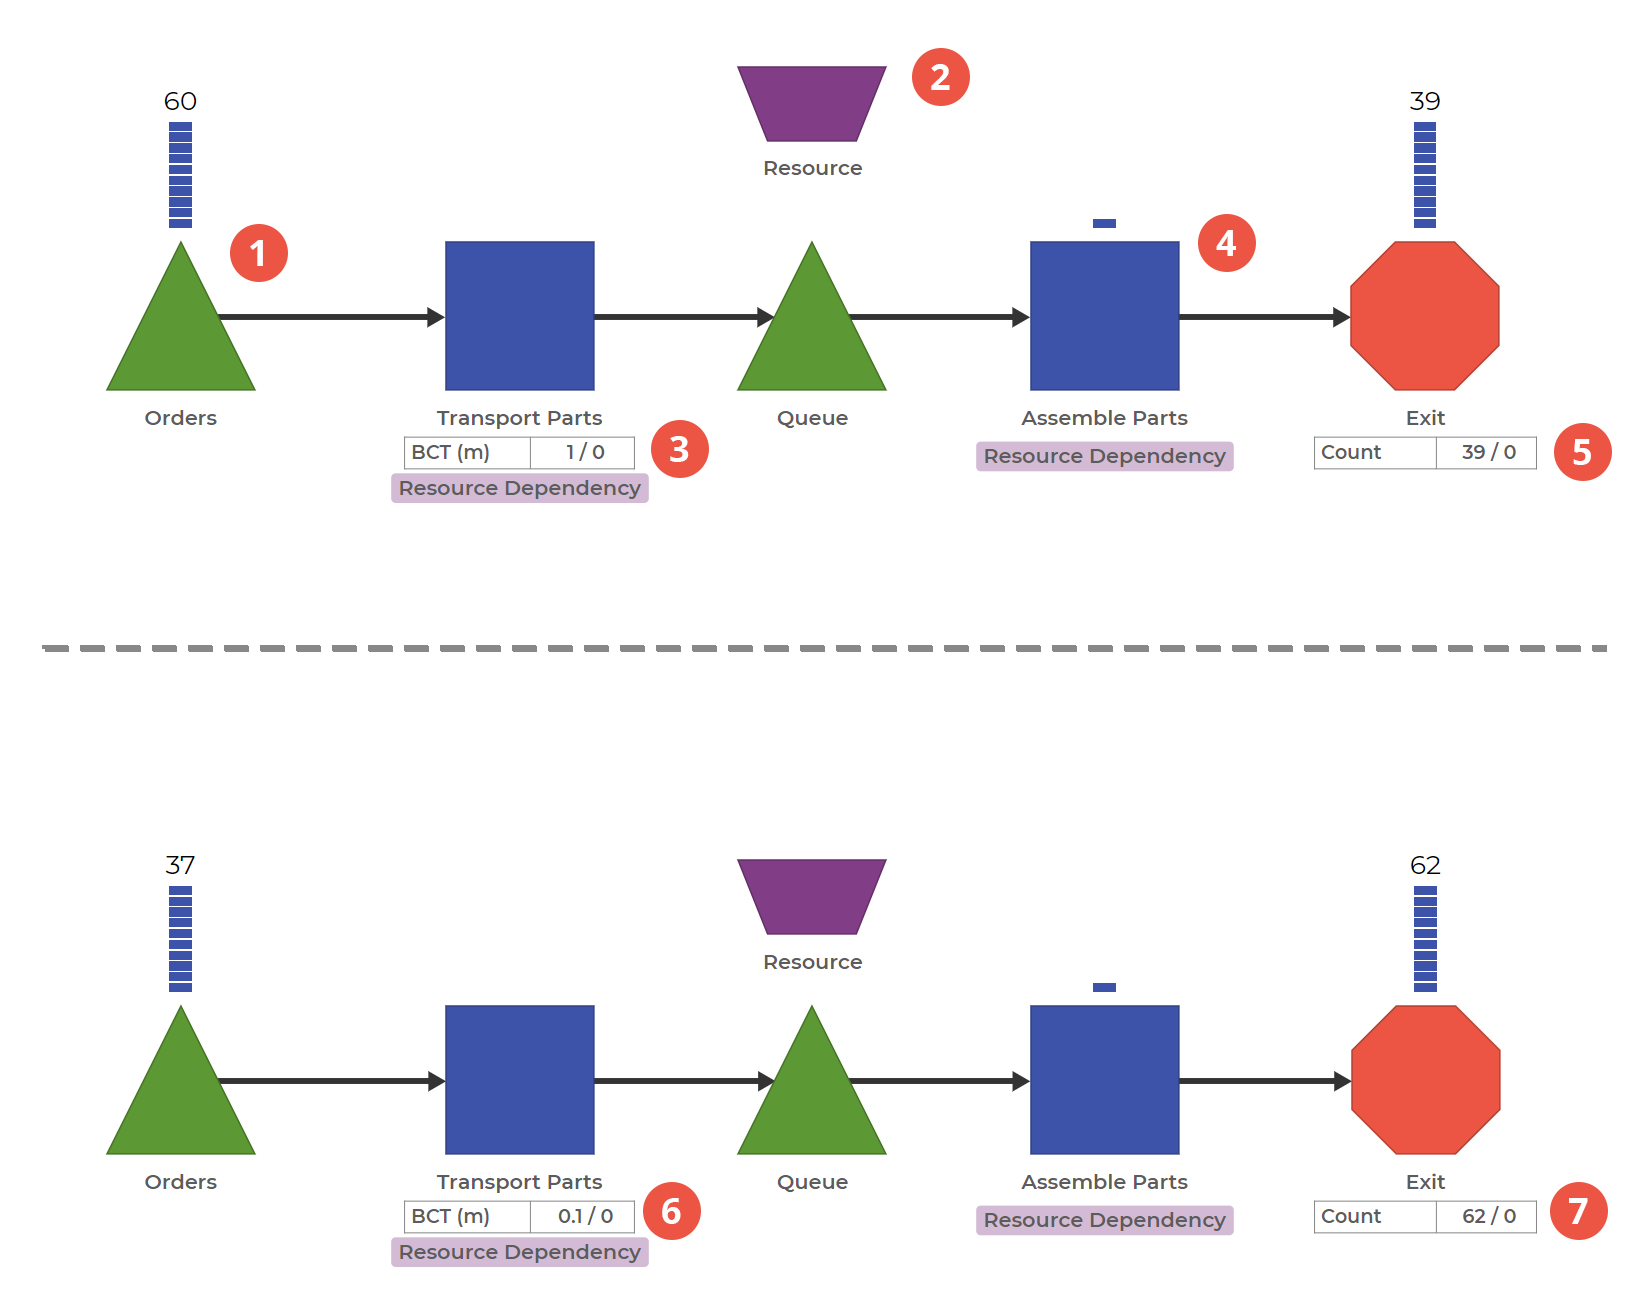
1. We start our process with 100 orders. This Queue Block has the Order item added, with an Initial On Hand parameter set to 100.
2. In this process, we have one operator who must transport the necessary parts and assemble them. This Resource Block is attached to the two Activities in this process to simulate moving between transportation and assembly.
3. Working on an order involves transporting the appropriate parts to the assembly station. In our baseline case, transporting parts takes exactly one minute, as indicated by the BCT (Block Cycle Time) result statistic.
4. Assemble the parts. The Resource then assembles the parts with a constant processing time of 1.5 minutes.
5. Notice the output of the initial process. If this number doesn't meet our expected target, then we know we have some work to do on process improvement.
6. Let's reduce the time spent transporting parts to 0.1 minutes. What is the result of this 90% reduction in time?
7. Notice the output of the improved process. We have increased the throughput of this one Resource from 39 orders to 62 orders. If this meets our targets, we can target some improvement projects to reduce the time spent on transportation.
Models can be a sandbox for checking assumptions and assessing the impact of different decisions. They can also demonstrate how much something needs to change in order to get the desired result and, therefore, help establish goals and targets for improvement. Transportation waste is an area that may be invisible, but by making it explicit in the model, you might be able to understand just how much it impacts your throughput.
Was this helpful?