1 Variance Chi-Square Test Tutorial
When to use this tool
Use the 1 Variance Chi-square test to compare the variance of a single population to a specified value. As an example, a post office is experimenting with a single queue feeding all its counters instead of multiple queues, and wants to test whether a single queue reduces variation in wait times for customers, compared to the historical variation in the wait times.
This test makes the following assumptions:
- The data are continuous numeric.
- The units are randomly sampled.
- The data are normally distributed.
Note: The 1 Variance test is sensitive to violations of the normal distribution assumption.
Using EngineRoom
This test can be used on raw data (i.e., the actual sample measurements) or sample summary data in the form of the sample variance.
Example:
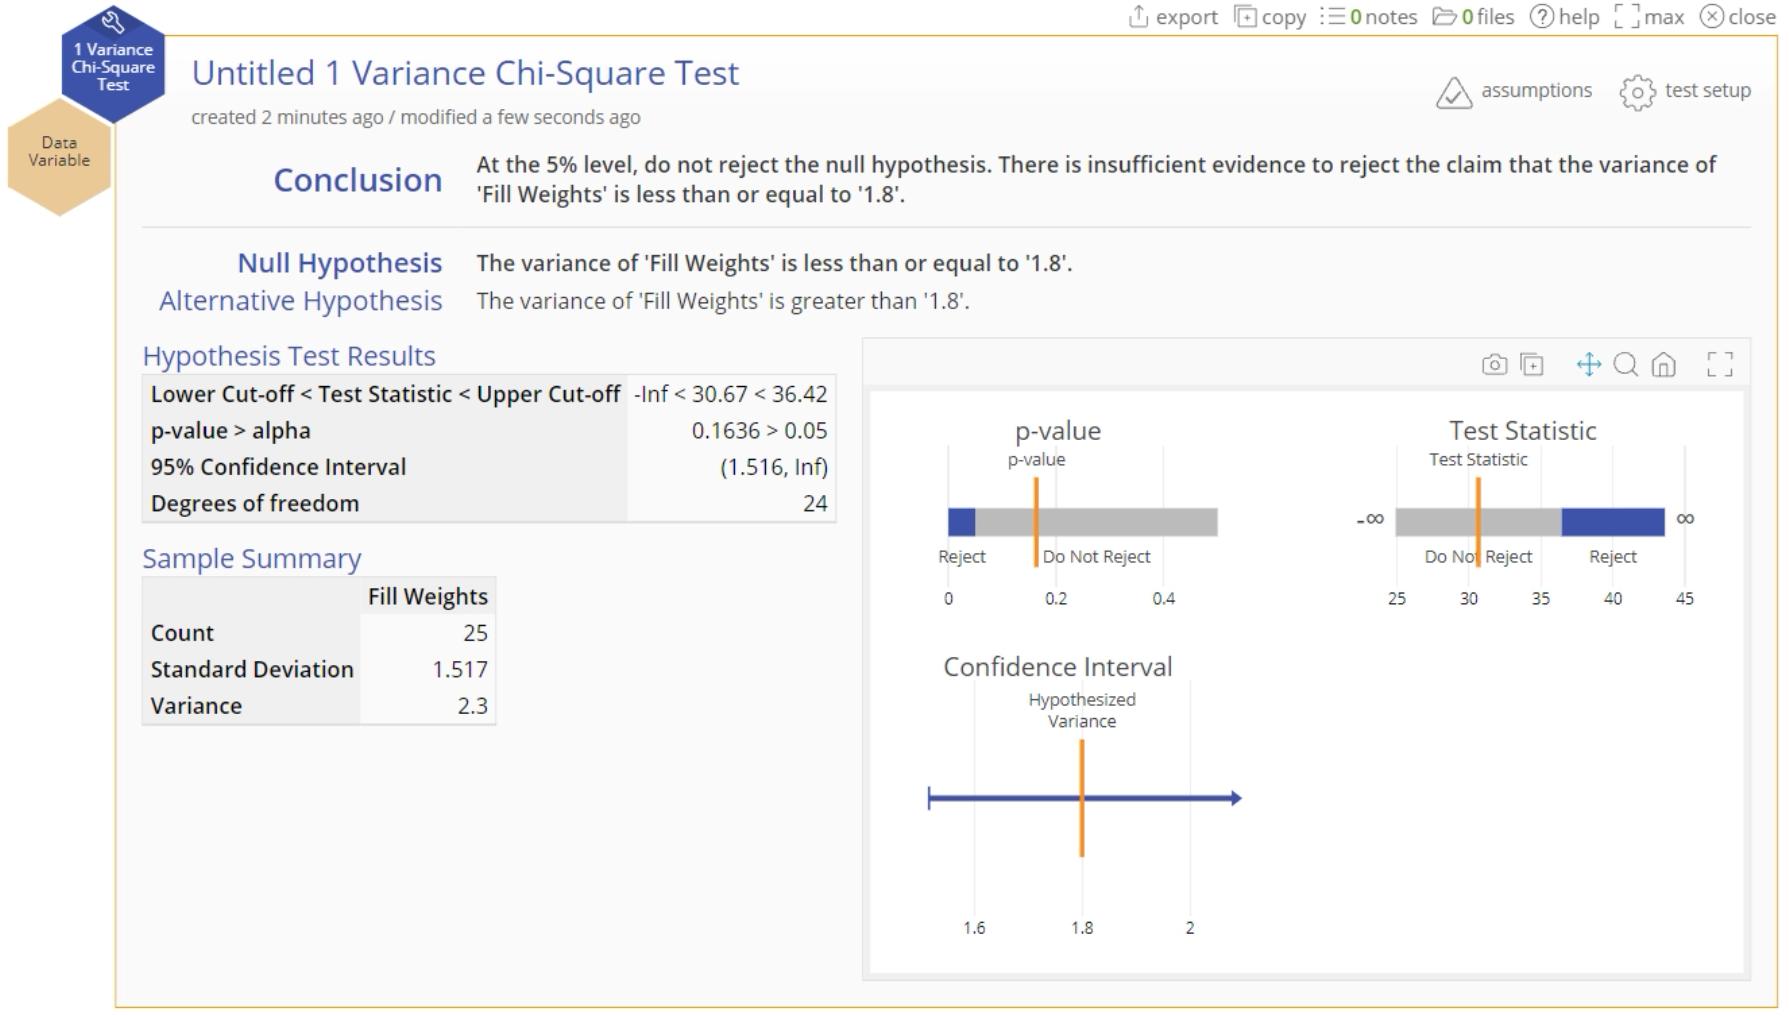
In this example, we want to test whether the fill weights of cereal boxes have a variance greater than 1.8 ounces² at the 5% level, using a random sample of 25 boxes.
Raw data
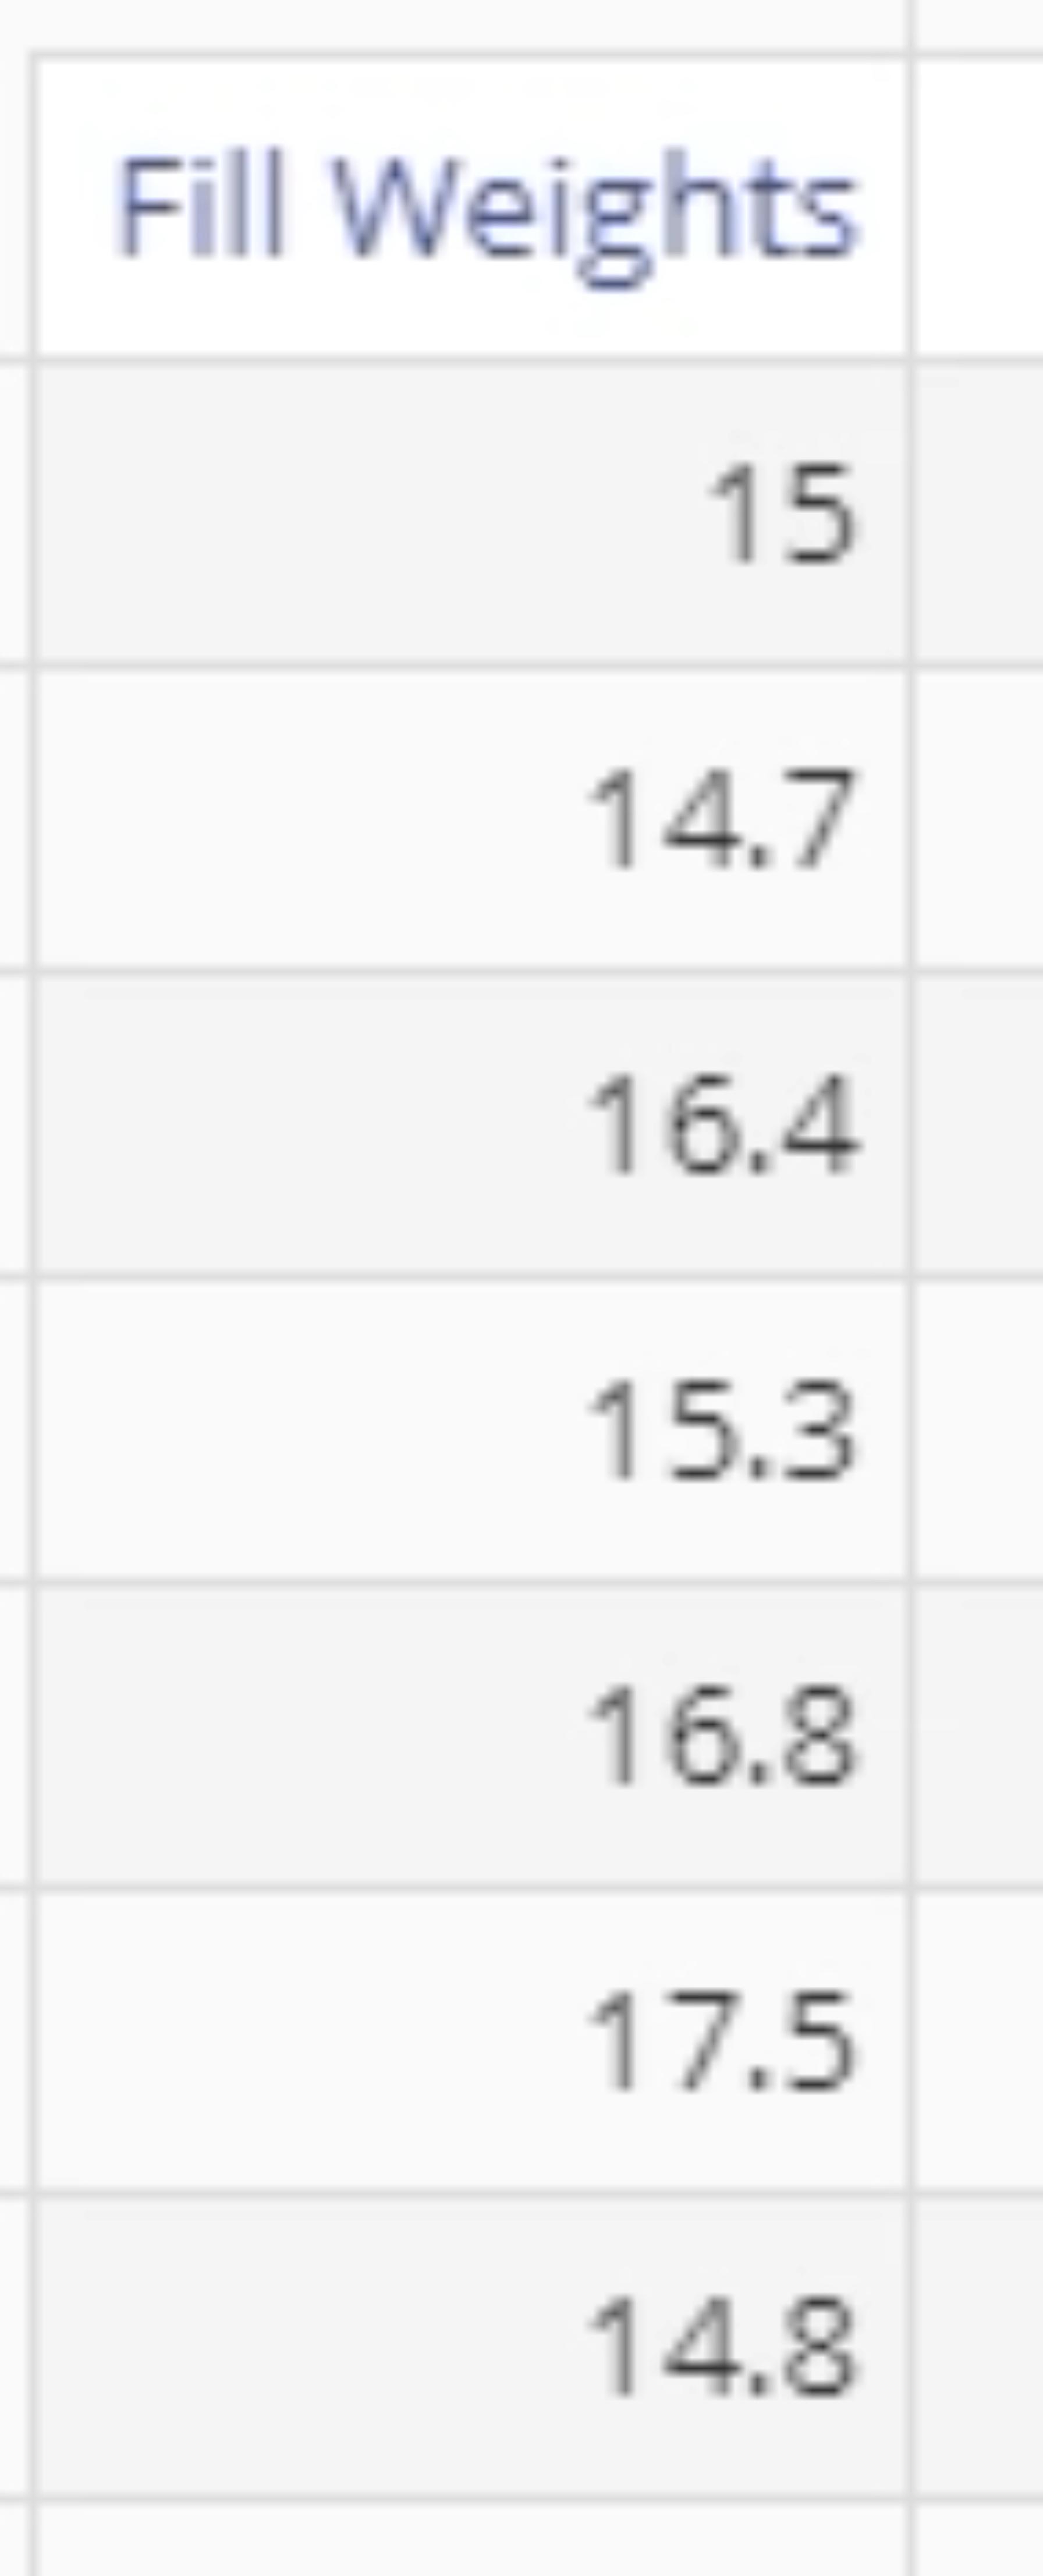
For raw data use a single column of measurements:
Select the 1 Variance test from the Parametric menu OR use the Hypothesis Testing Wizard. We will use the test directly from the Parametric menu:
Steps:
- Select the Analyze menu > Parametric > Click on the 1 Variance Chi-square Test
- Click on the data file in the data sources panel and drag the Fill Weights variable onto the Data variable drop zone on the study.
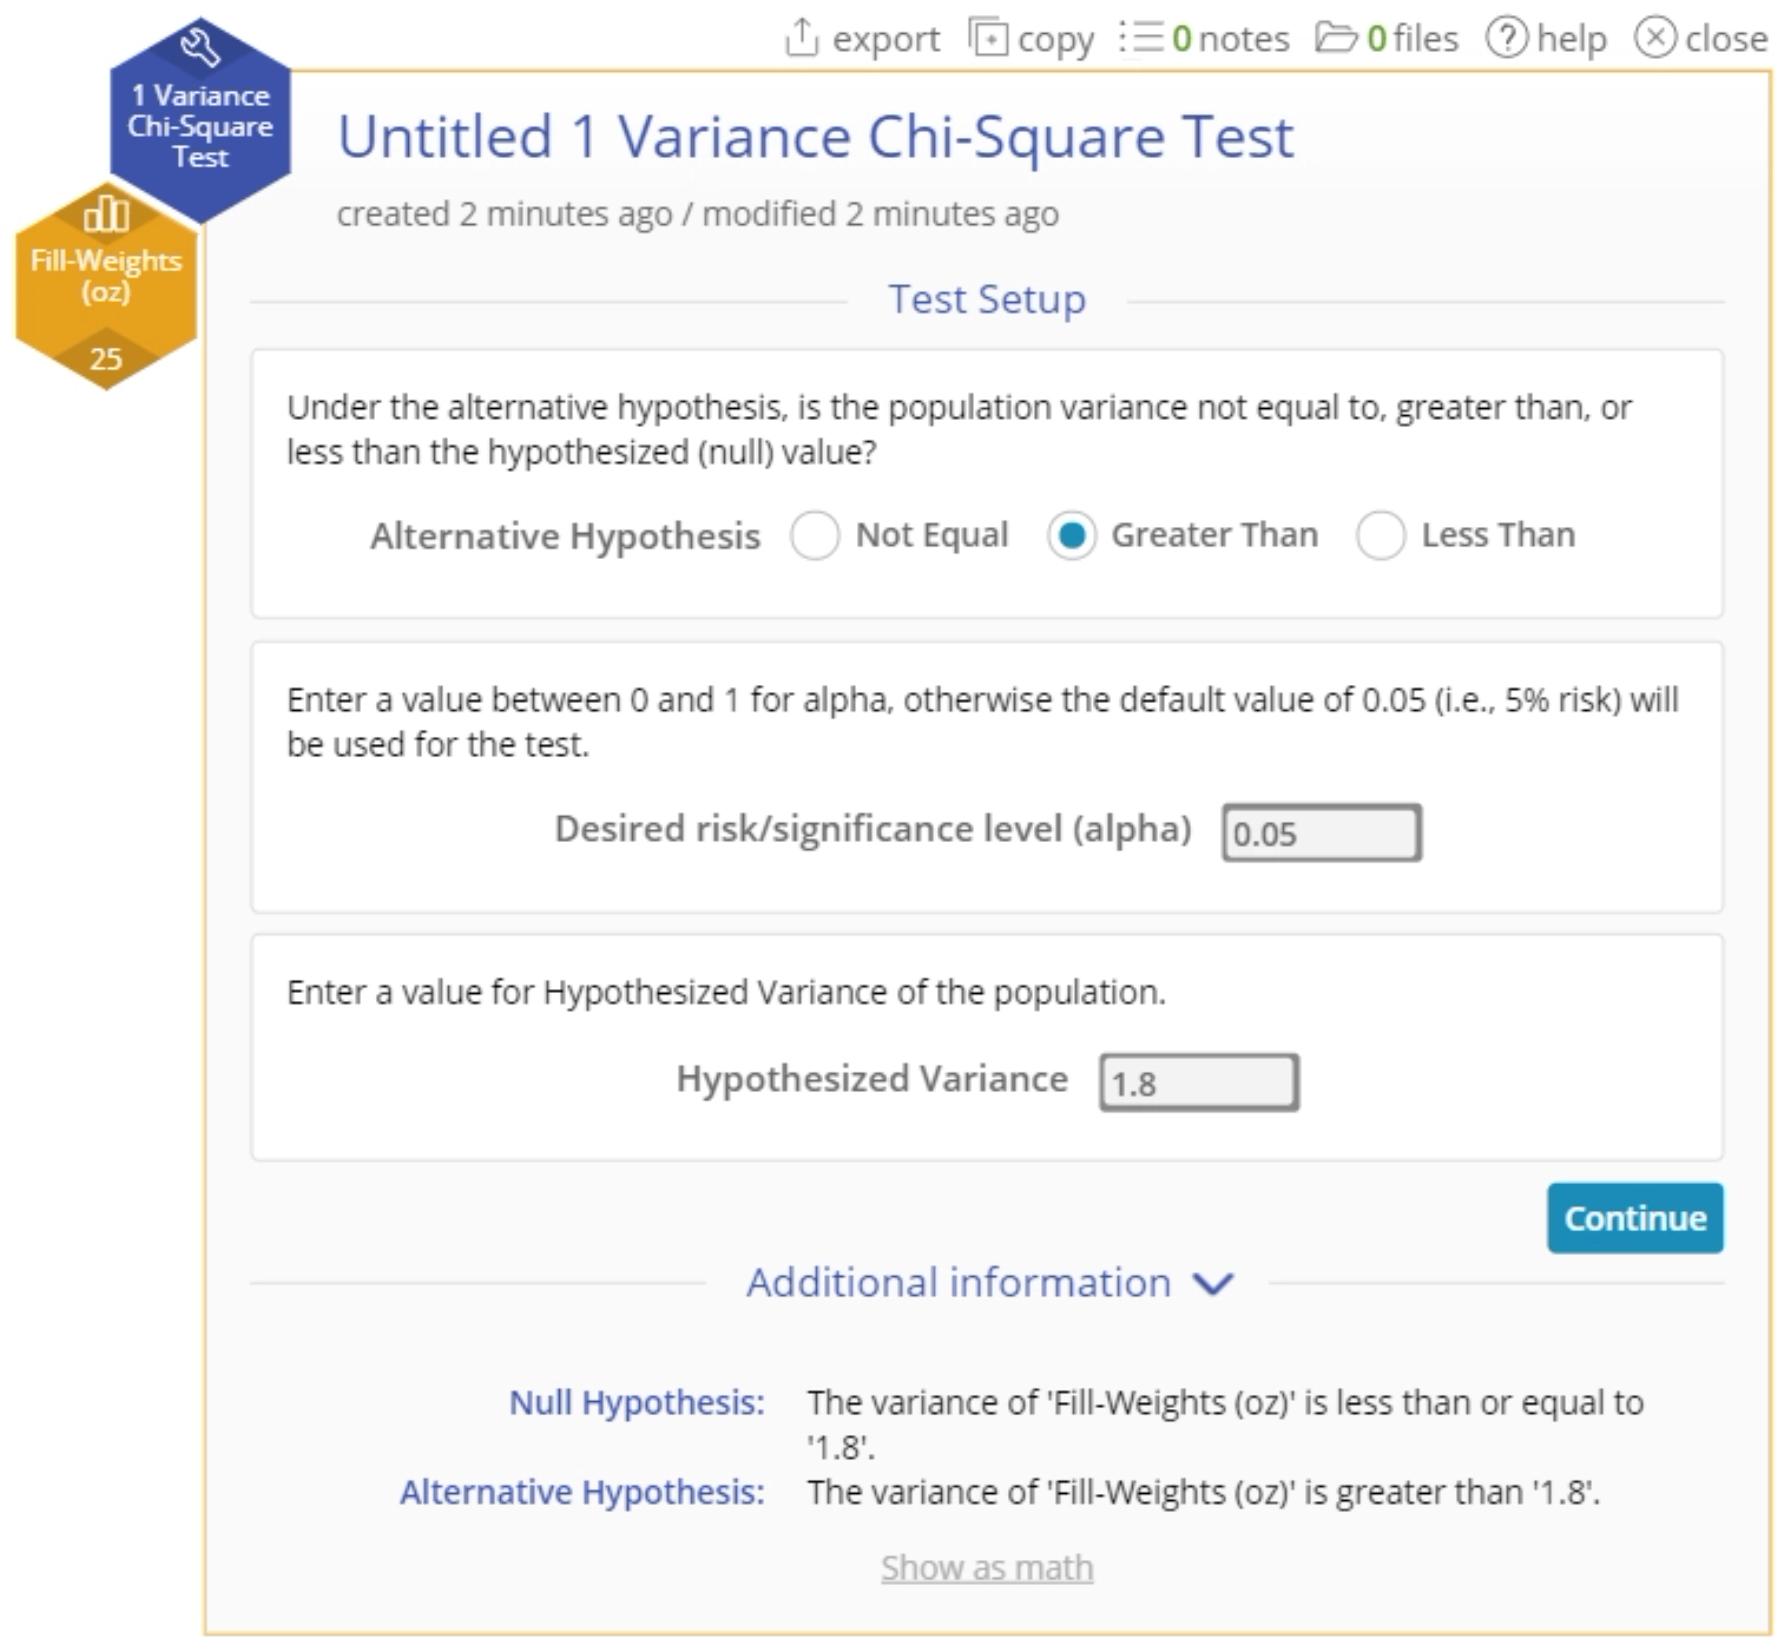
- Set up the test as shown, and click Continue:
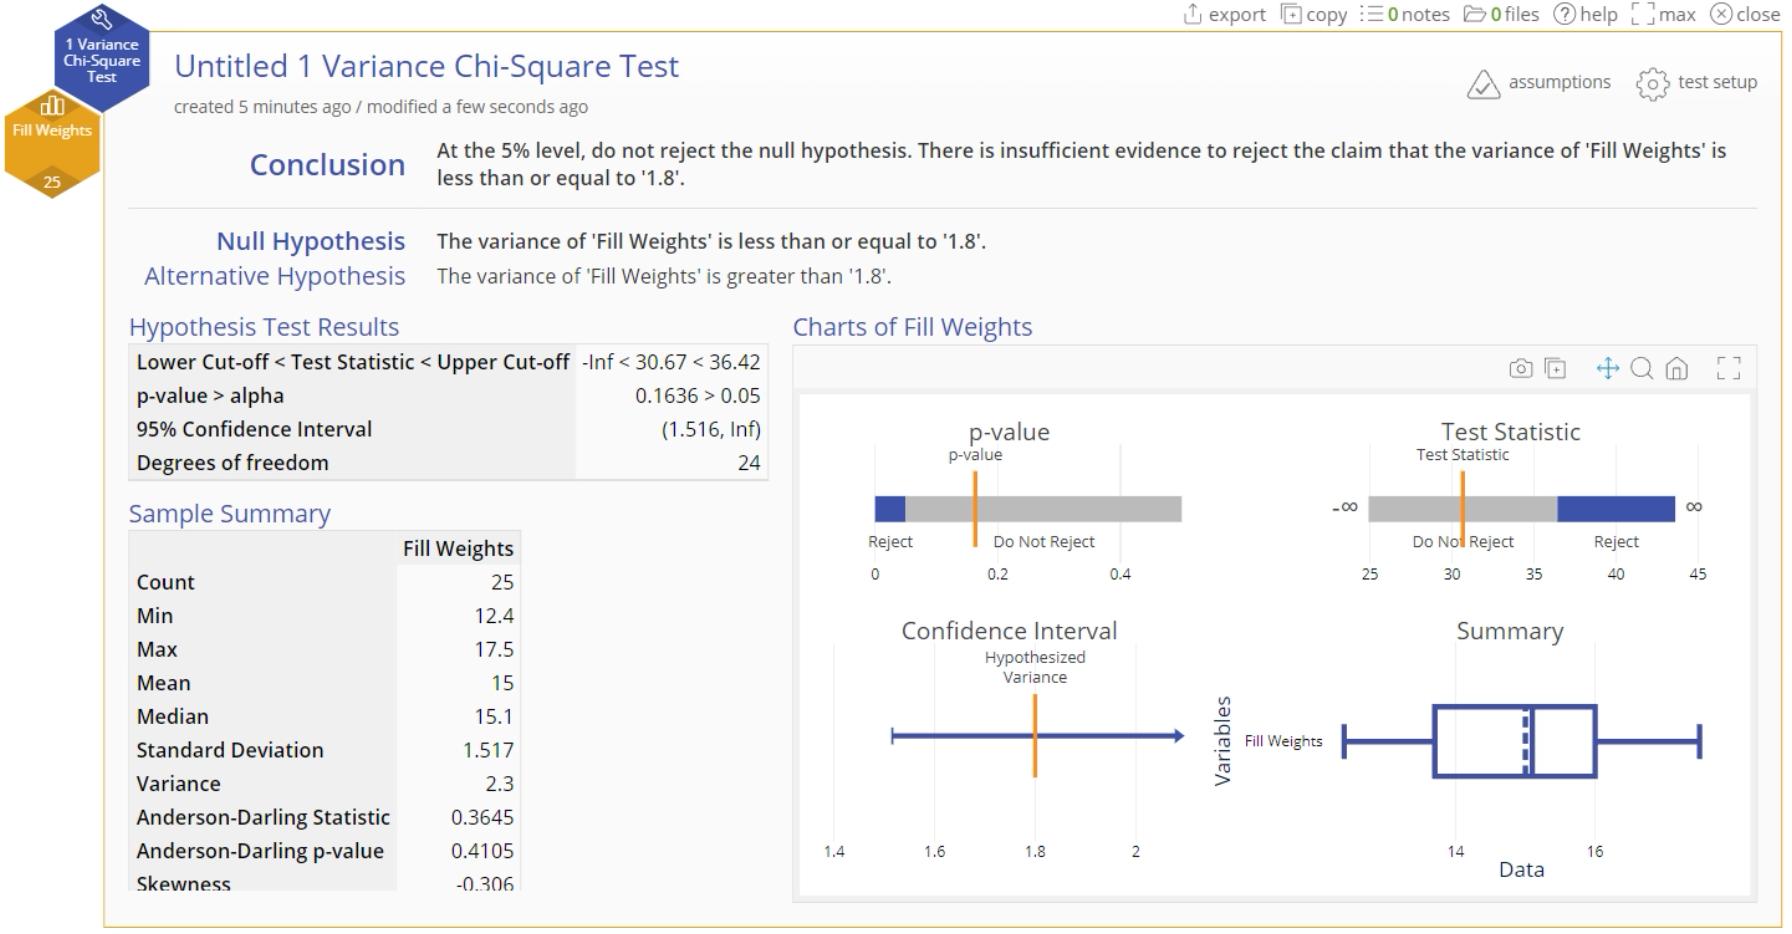
- The 1 Variance test output using raw data is shown:
Sample summary statistics
Now let's run the same test using the summary statistics from the data: Given Sample size = 25 Variance = 2.3 ounces²
Steps:
- Select the Analyze menu > Parametric > Click on the 1 Variance Chi-square Test
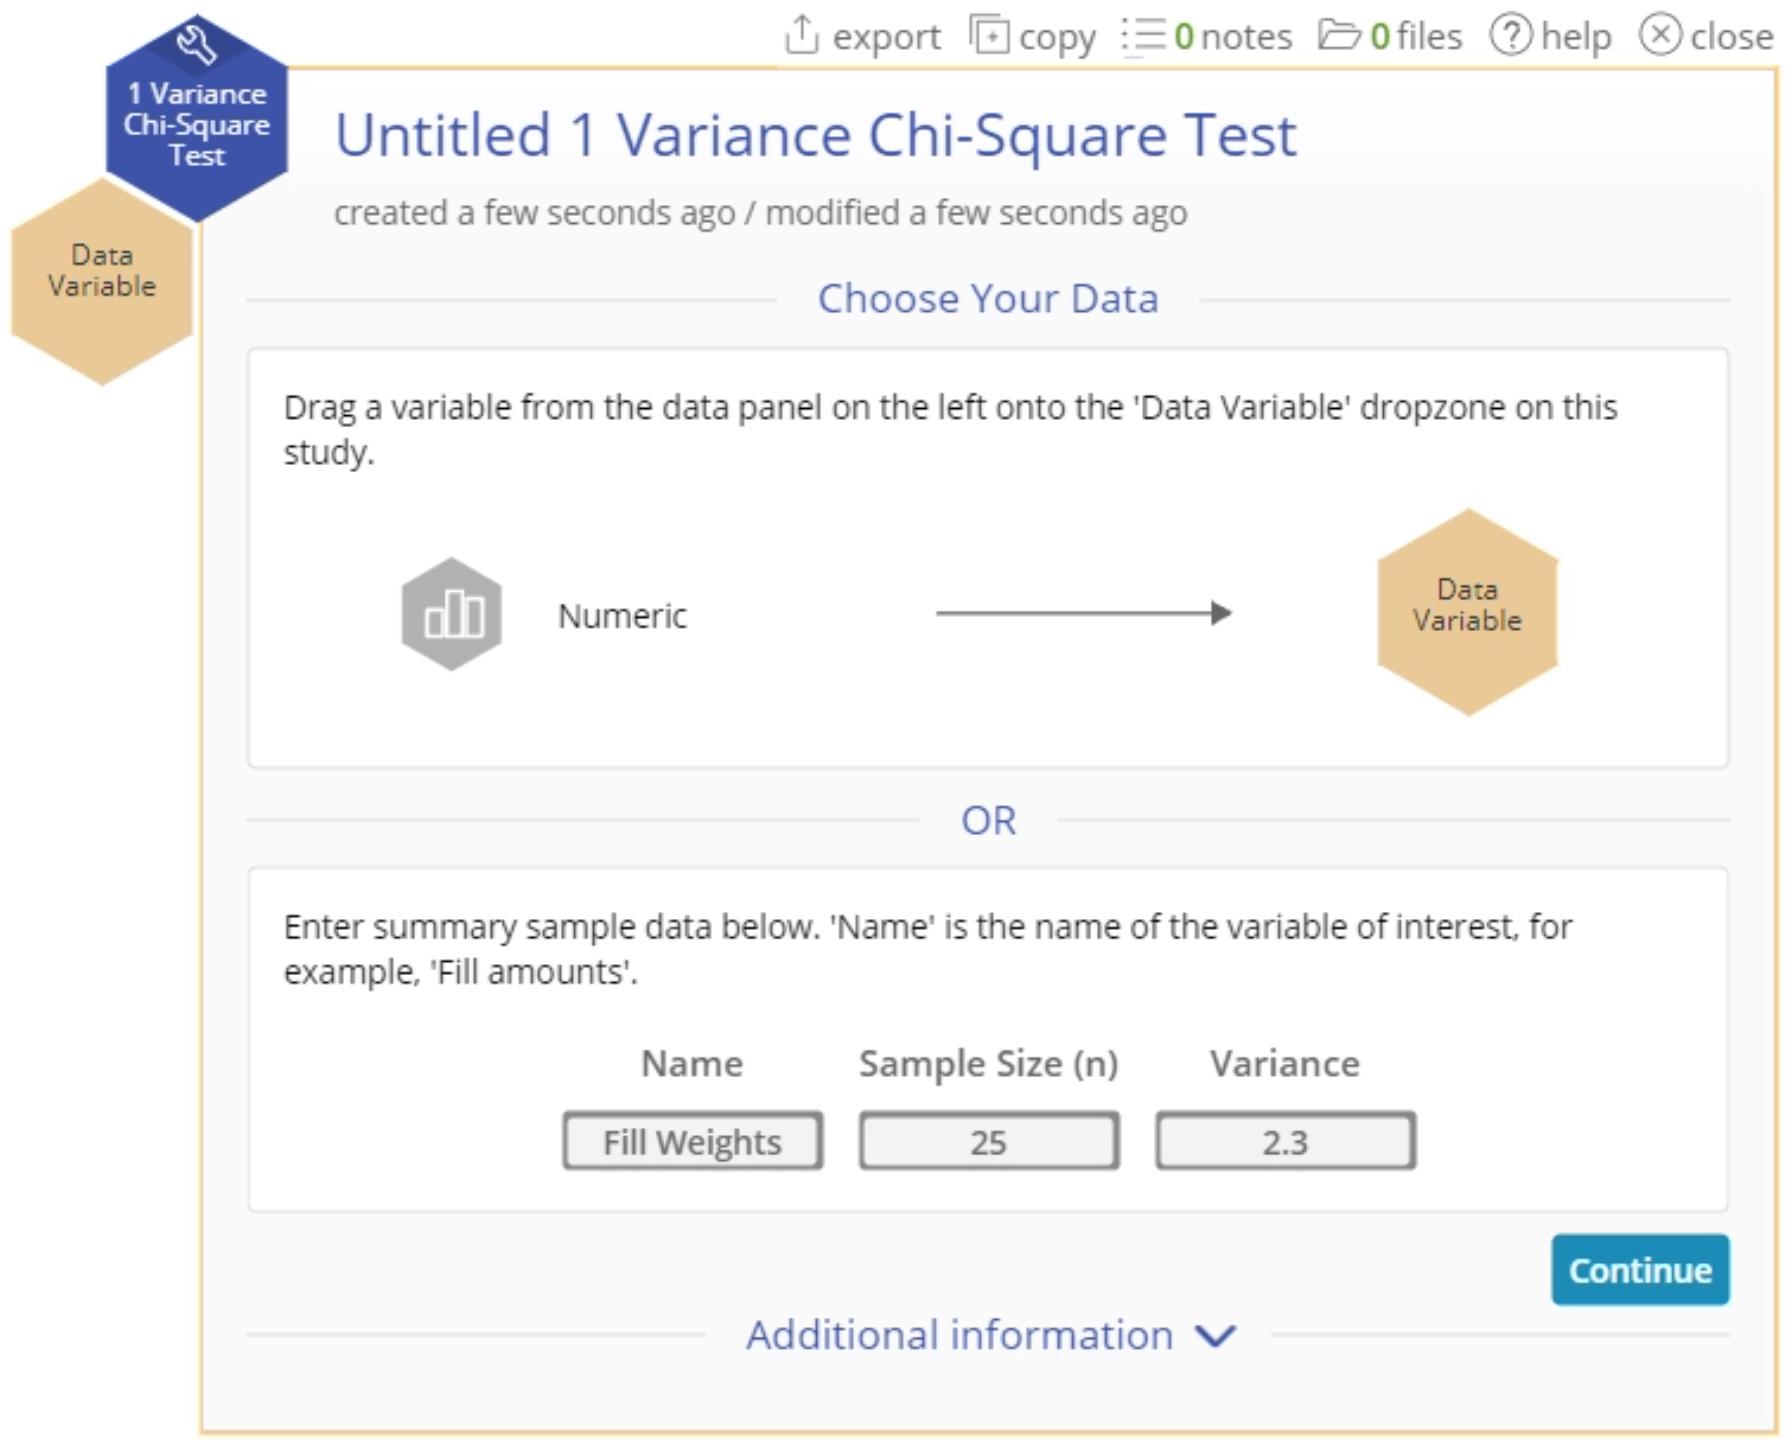
- Enter the summary statistics for the fill weights data as shown and click Continue:
- Fill out the Test Setup screen as before and Click Continue.
- The 1 Variance Test output using sample summary data is shown:
1 Variance Chi-Square Test Video Tutorial
Instructor Resources
Was this helpful?

