Paired Samples Sign Test Tutorial
When to use this tool
Use the Paired Samples Sign Test to compare the medians of two related (paired) continuous populations, such as 'Before' and 'After' measurements of test scores for the same group of subjects. As an example, a health insurance company compares the median sales of its associates before and after putting them through a new sales training program in order to test the effectiveness of the new program.
The test statistic is based on the median of the differences of the paired observations across the two samples, and can be used on non-normal data.
The test makes the following assumptions:
- The data are continuous numeric.
- The units are randomly sampled.
If the distribution of differences is symmetric, use the Paired Samples Wilcoxon Signed Ranks Test instead.
Using EngineRoom
Note: You must have raw data to run this test. For the Paired samples test, make sure the number of observations in the two groups is equal.
Example:
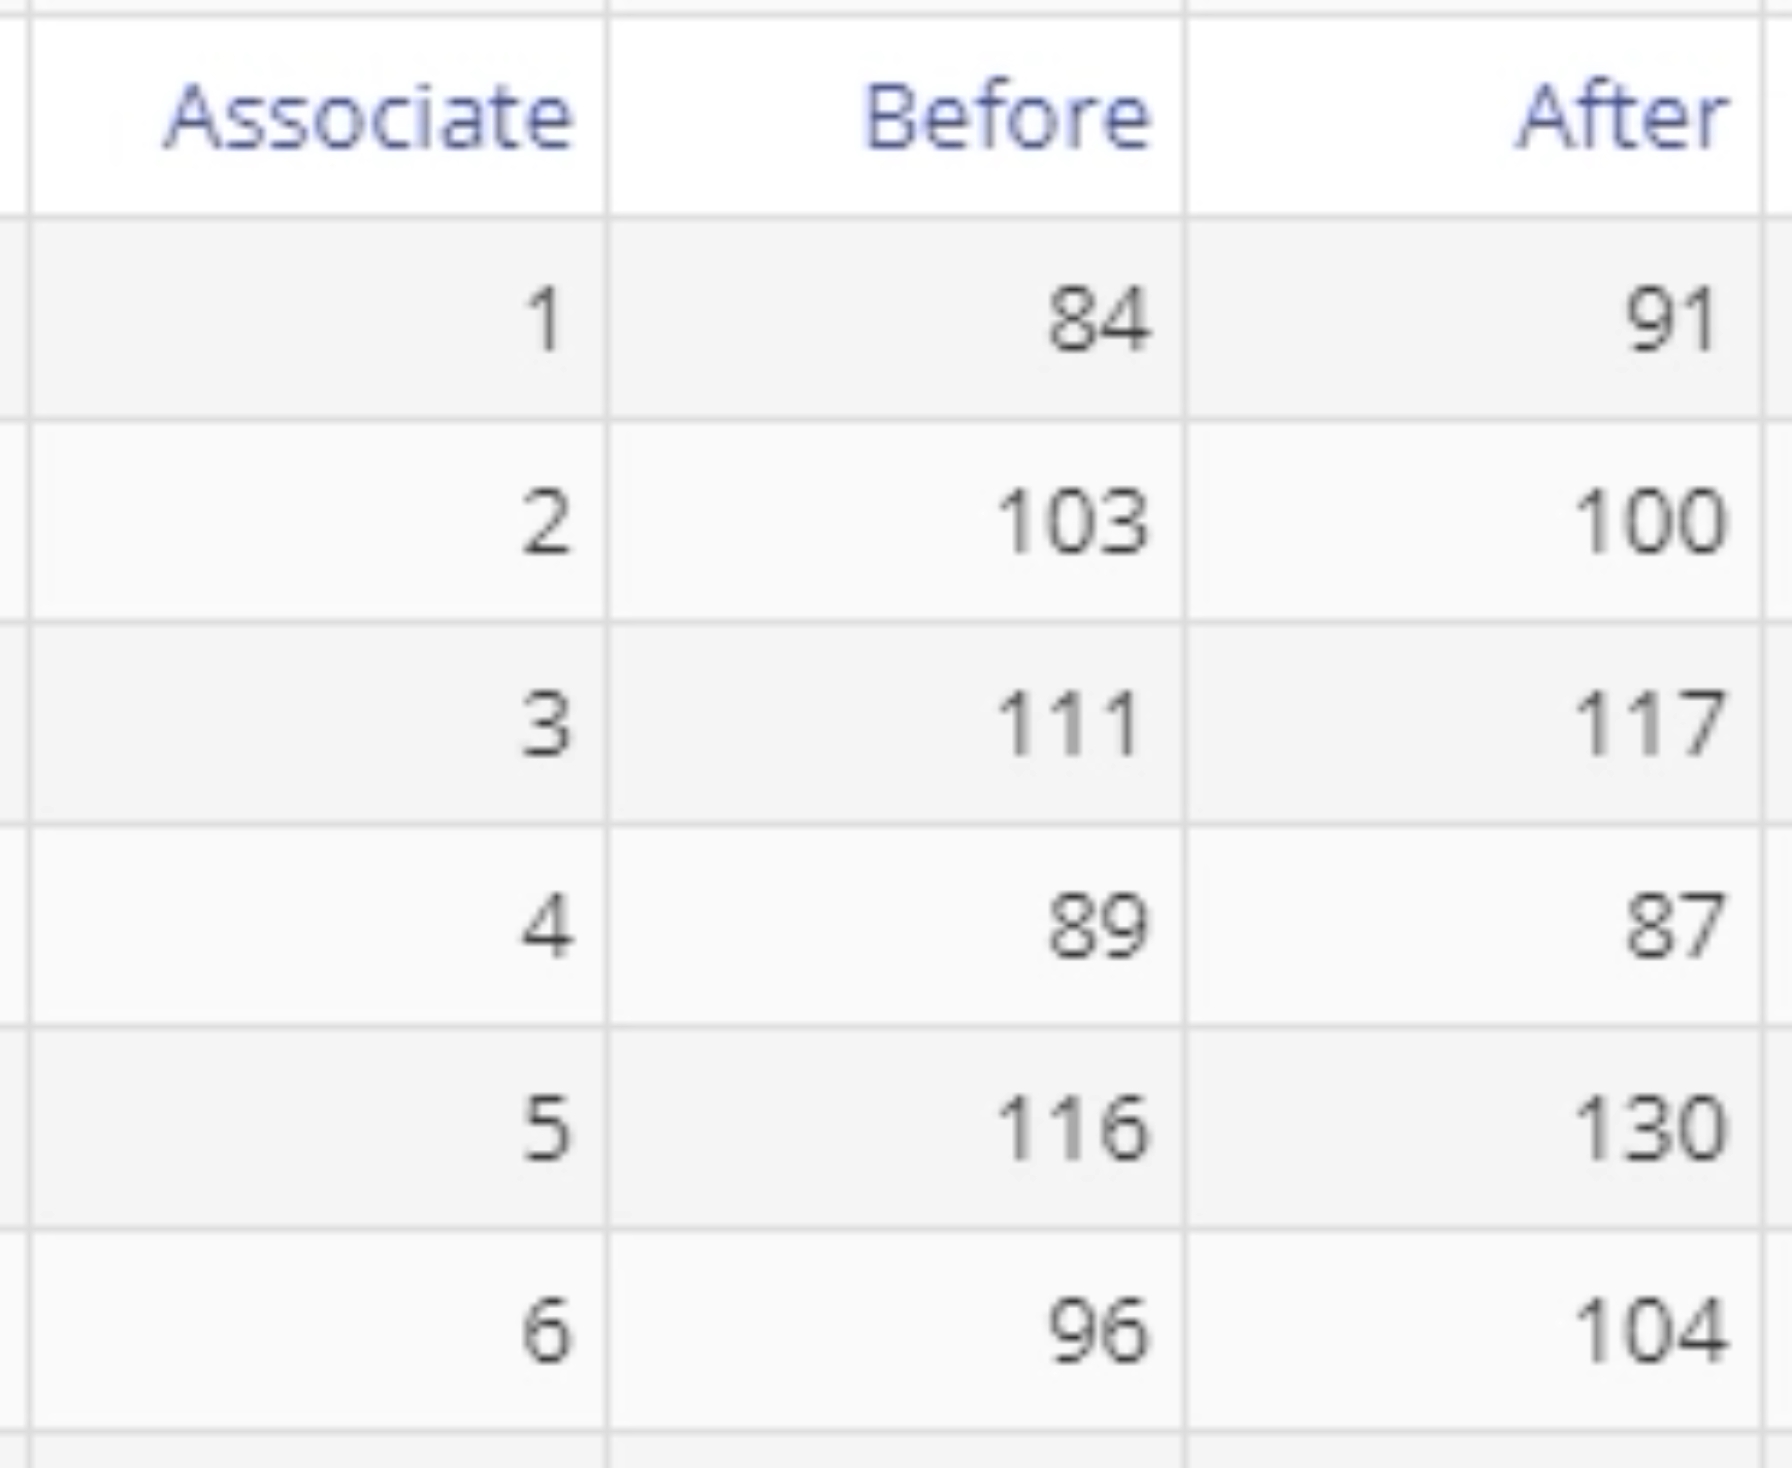
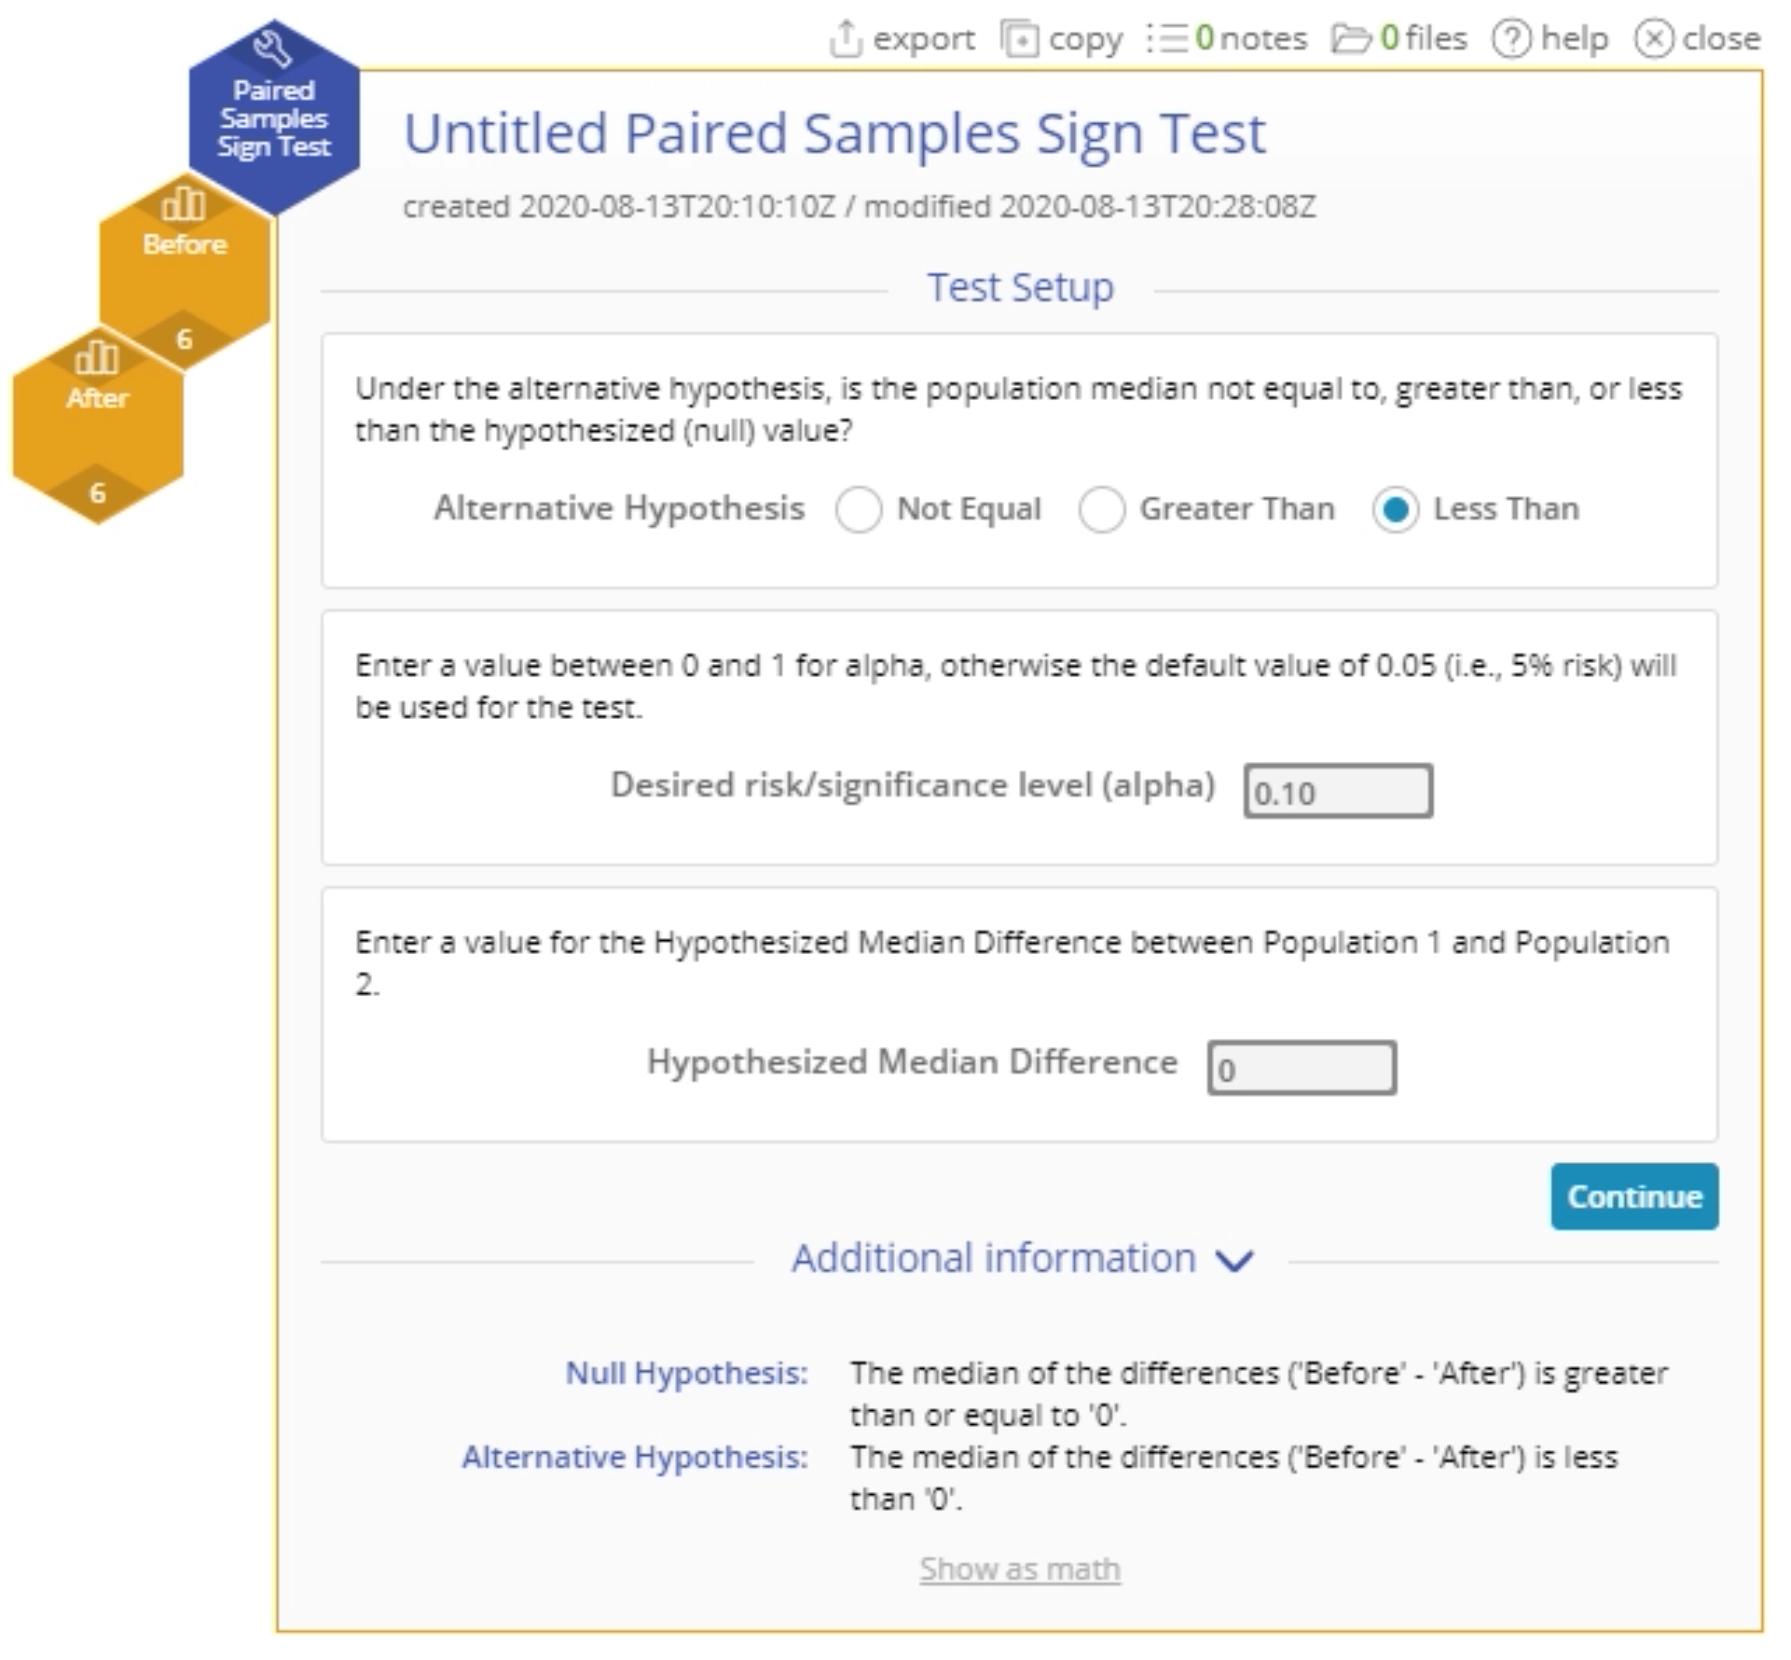
The data for this example consists of the Before and After sales of six associates who went through a new sales training program. We want to test, at the 10% level, whether the training was effective, i.e., is the median of the differences d = (Before - After) less than 0?
Steps:
- Select the Analyze menu > Non-parametric > Click on the Paired Samples Sign Test.
- Click on the data file in the data sources panel and drag the Before and After variables onto the Data variable drop zones on the study.
- Set up the test as shown, and click Continue:
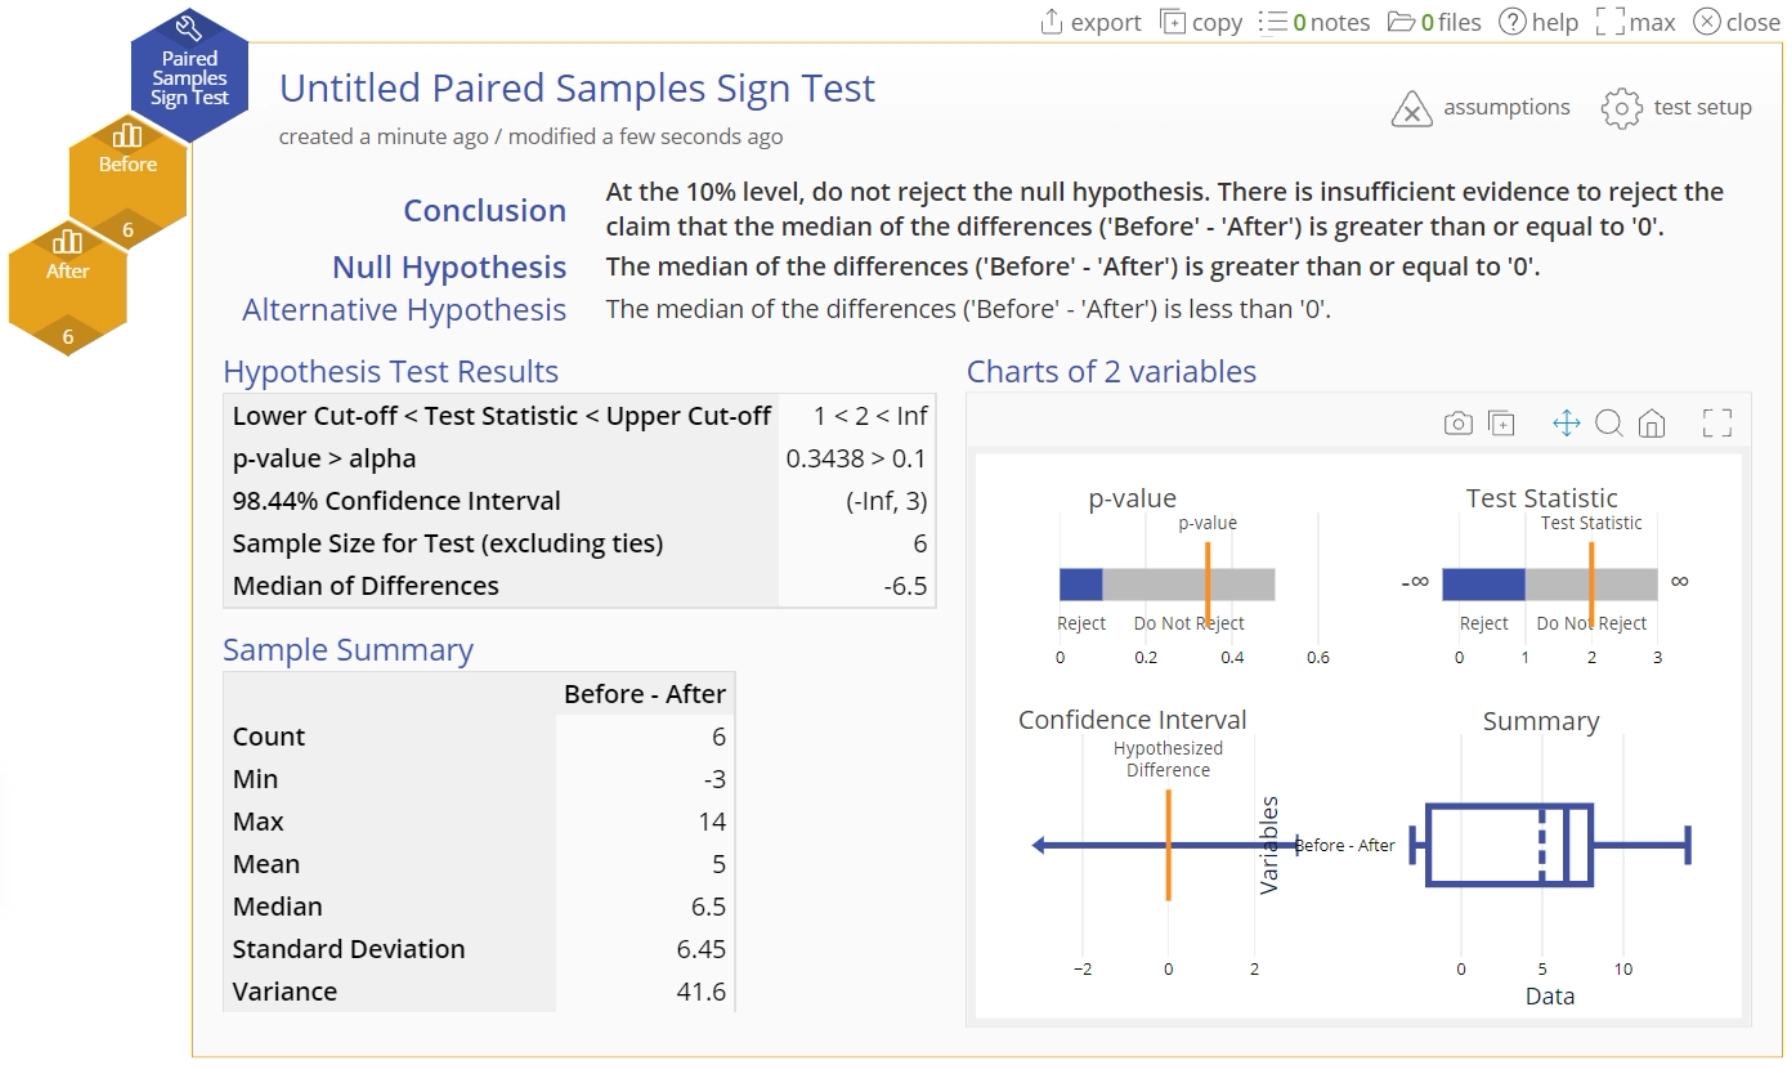
- The Paired Samples Sign Test output is shown:
The large p-value shows that there isn't enough evidence at the 10% level to show that the training program was effective.
Paired Samples Sign Test Video Tutorial
Instructor Resources
Was this helpful?


