Chi-Square Test of Association Tutorial
When to use this tool
A Chi-Square Test of Association is a non-parametric statistical test used to determine whether there is a significant relationship between two categorical variables.
The Chi-Square Test of Association is used when:
- Both variables are categorical (nominal or ordinal): This means the data are divided into two or more groups or categories (e.g., pass/fail, red/blue/green, different levels of quality, low/medium/high, etc.).
- You want to test whether the distribution of counts for one variable differs depending on the category of the second variable.
Using EngineRoom
The data can be in the following formats:
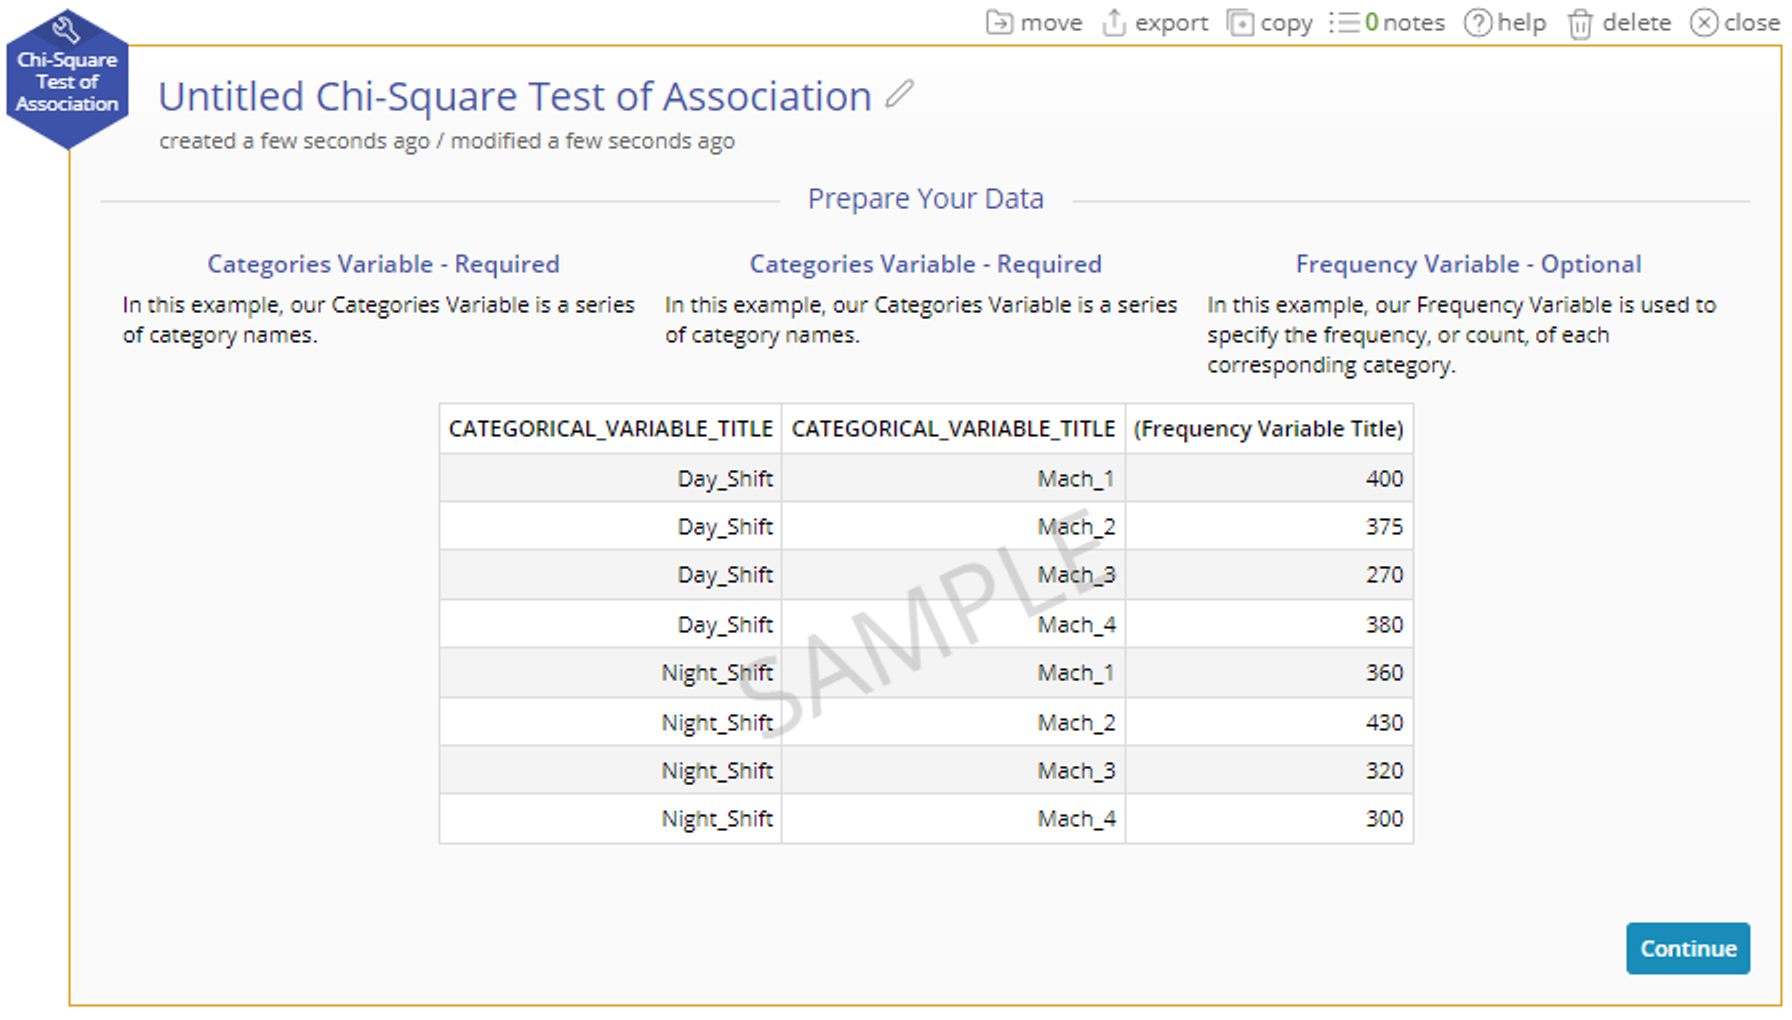
Summary Data: This format consists of three columns. The first two columns represent different levels of the variables, with each row showing a unique combination of these levels. The third column contains the counts or frequencies for each combination. These counts represent how often each combination of the variables occurs.
Raw Data: In this format, there are two columns, each representing different levels of the variables. Each row contains a combination of these levels, repeated multiple times depending on the dataset. The tool will automatically summarize this raw data into a contingency table, which shows the count of each unique combination.
Summable Data: This format also has three columns. The first two columns represent different levels of the variables, and the same combinations of these levels may appear multiple times. The third column contains numerical values (counts or frequencies) associated with each combination. The tool will sum the values in the third column for each unique combination, and these totals will be used in the calculation.
Example:
You are a quality assurance manager at a manufacturing company that produces automotive components using four different machines: Machine 1, Machine 2, Machine 3, and Machine 4. The company prides itself on delivering high-quality parts, but over the past few months, there has been an increase in the number of defects identified during the inspection process.
The defects have been classified into three main categories:
- Surface Defects: These include imperfections such as scratches, dents, or uneven surfaces.
- Dimensional Defects: These refer to parts that do not meet the specified dimensions, such as being too large, too small, or out of tolerance.
- Structural Defects: These involve deeper issues in the material's integrity, such as cracks or weaknesses in the structure.
The production team suspects that certain machines may be associated with specific types of defects. For example, some operators believe that Machine 1 is more prone to producing parts with surface defects, while Machine 3 seems to be responsible for most of the structural defects.
You decide to conduct a Chi-Square Test of Association to determine if there is a significant relationship between the machines used in production and the type of defects that occur. The goal is to investigate whether certain machines are more likely to produce specific types of defects, which could help the team identify underlying problems with equipment or processes.
Steps:
1. Select the Analyze menu > Non-Parametric > Chi-Square Test of Association.
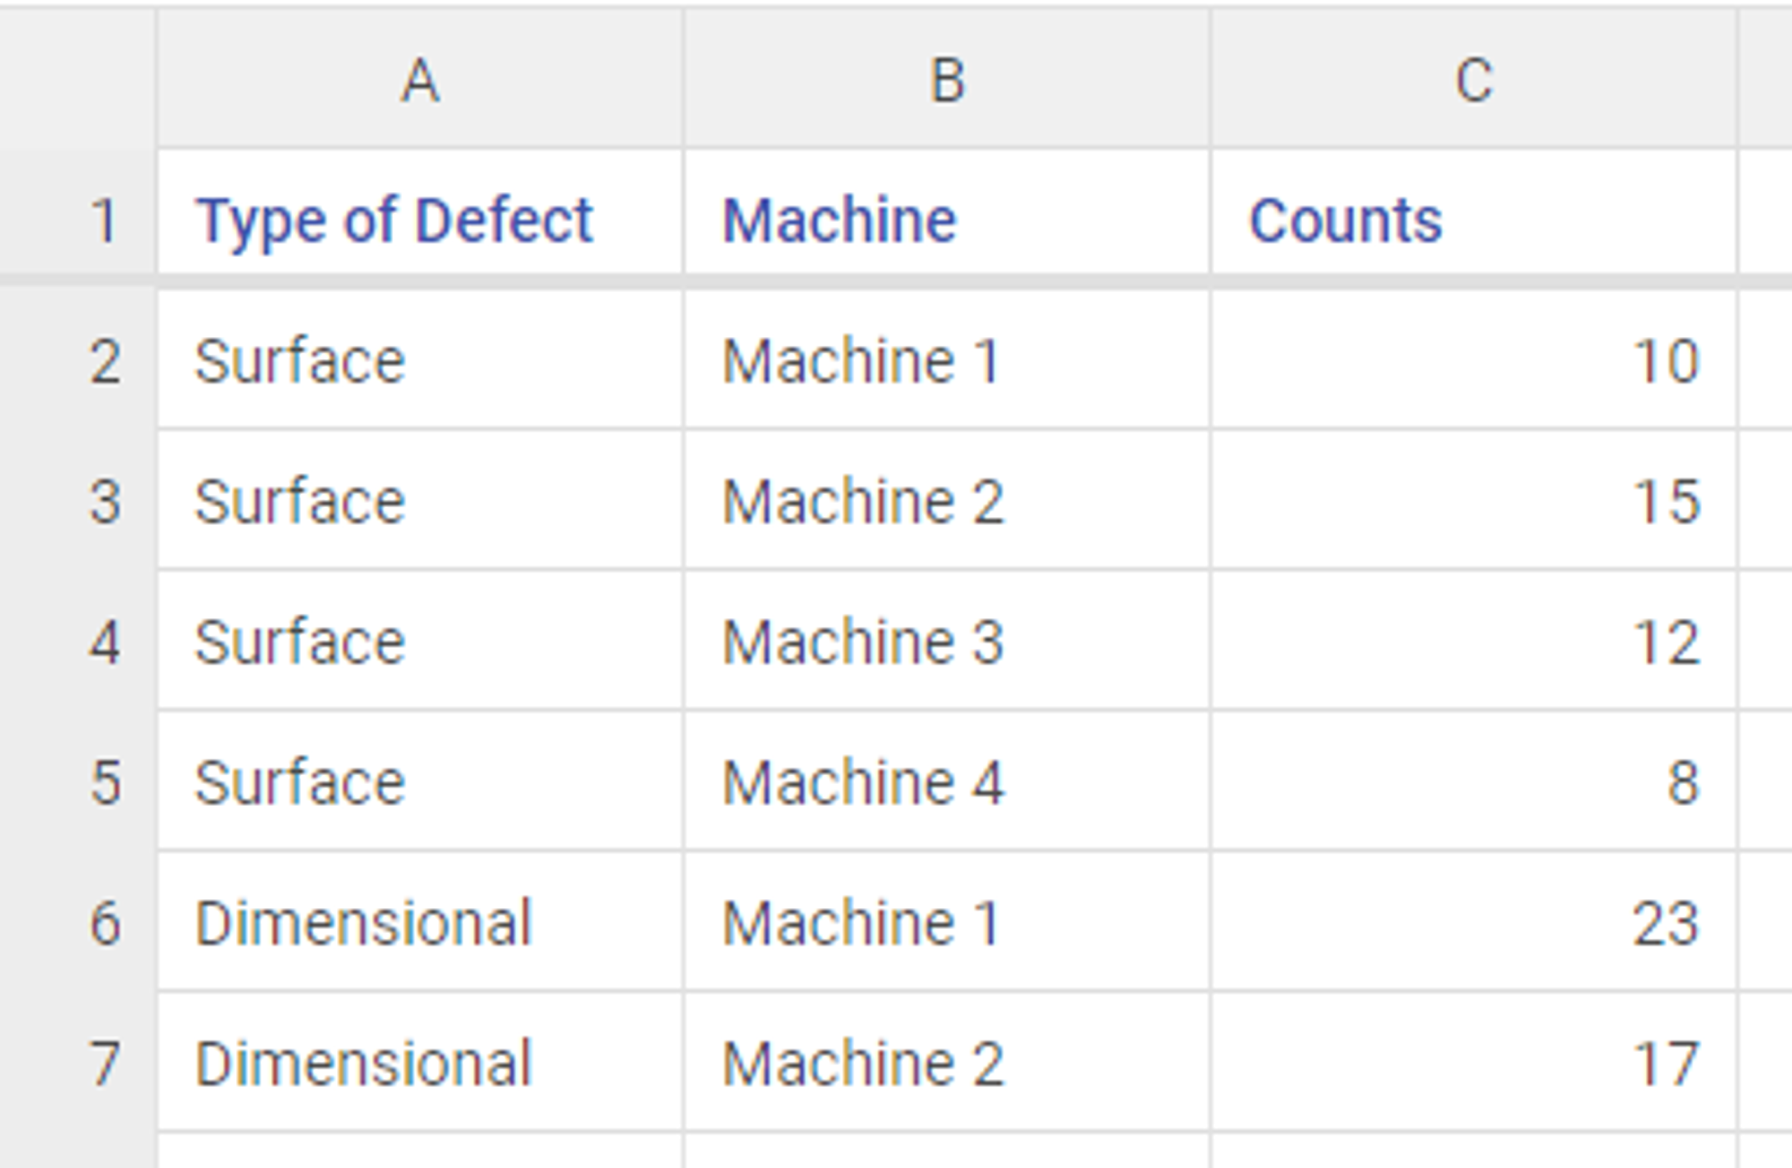
2. Upload the data. You'll notice that this data is formatted in a Summary Table format.
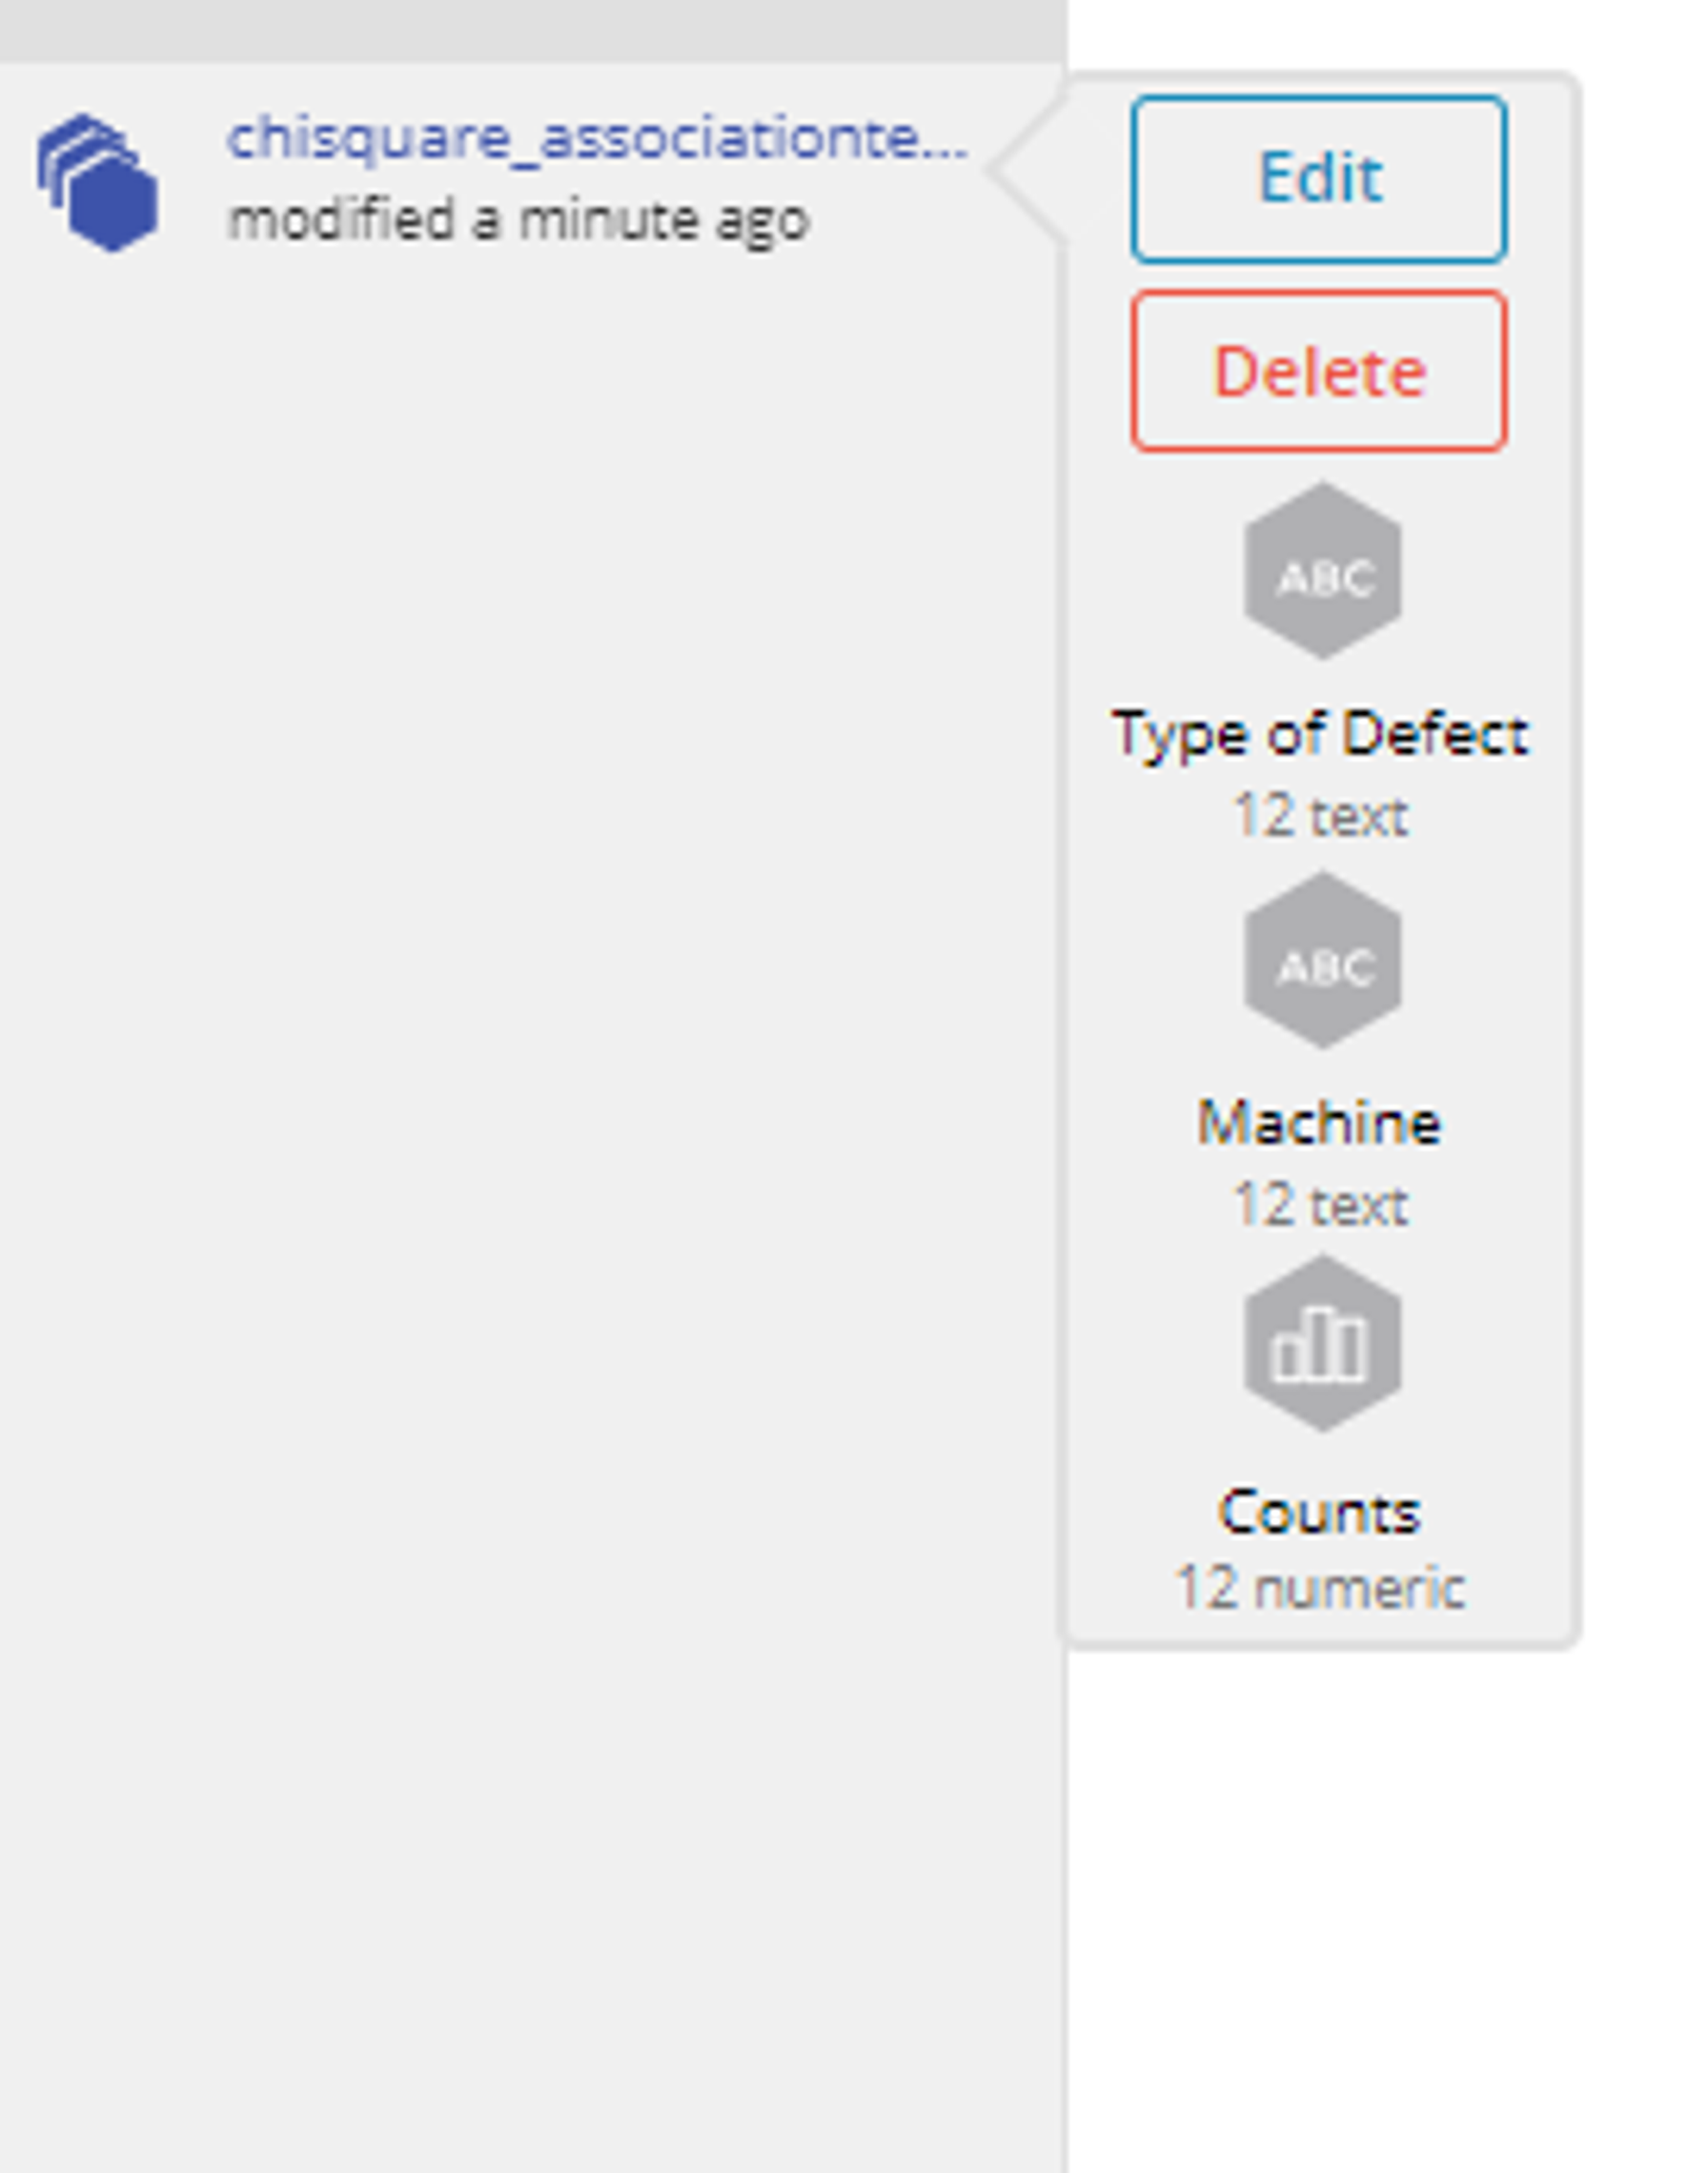
3. Click on the data set to view the variables.
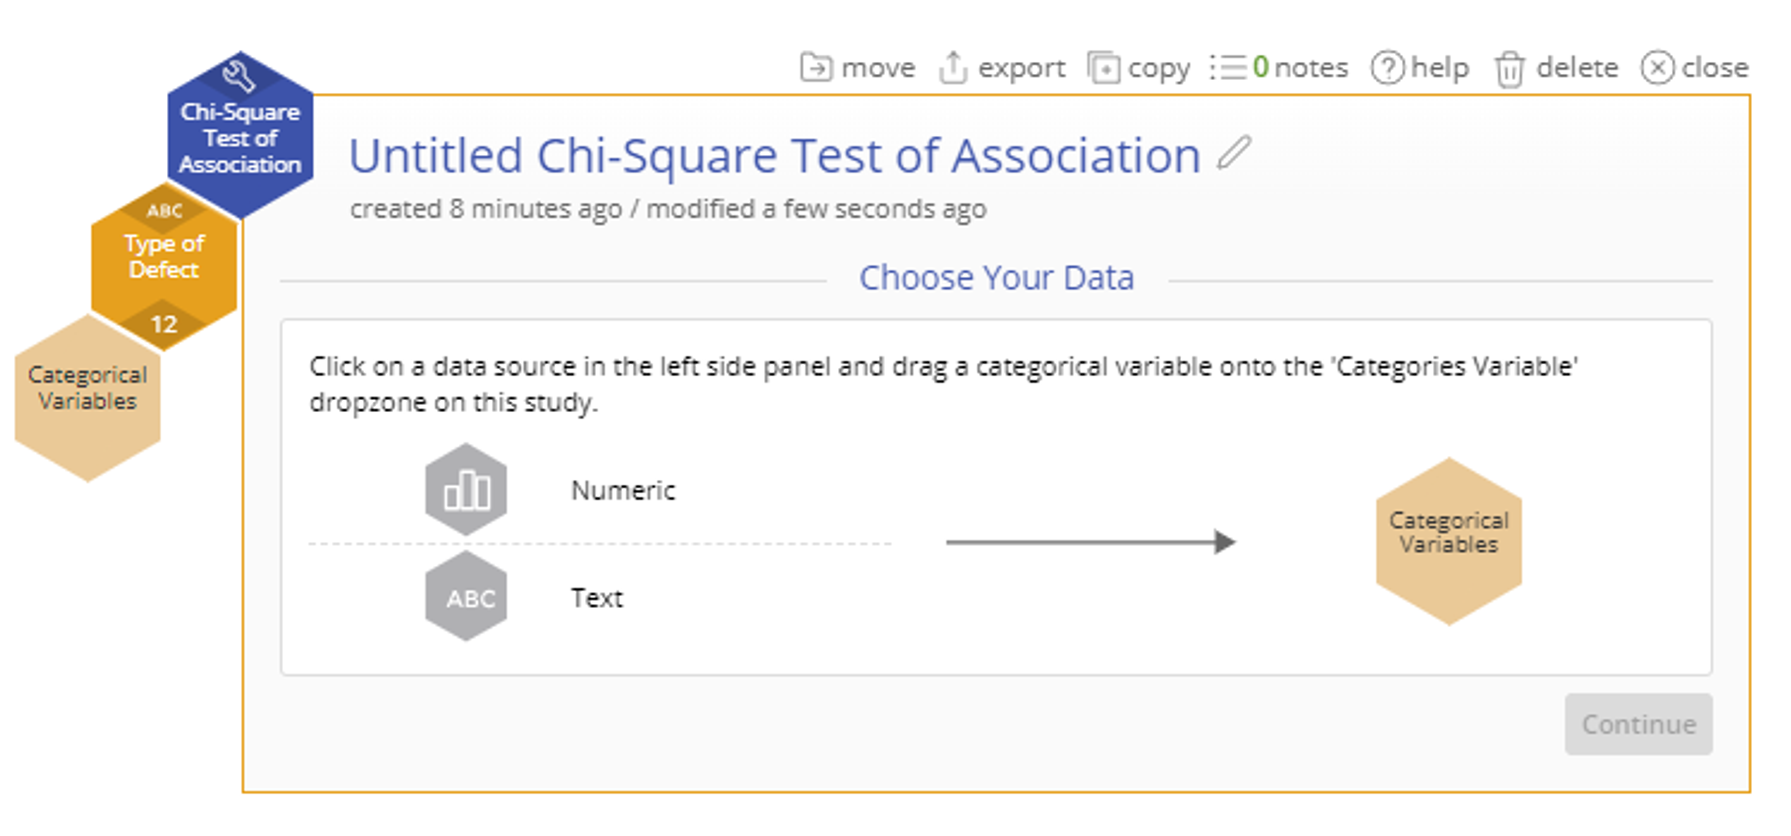
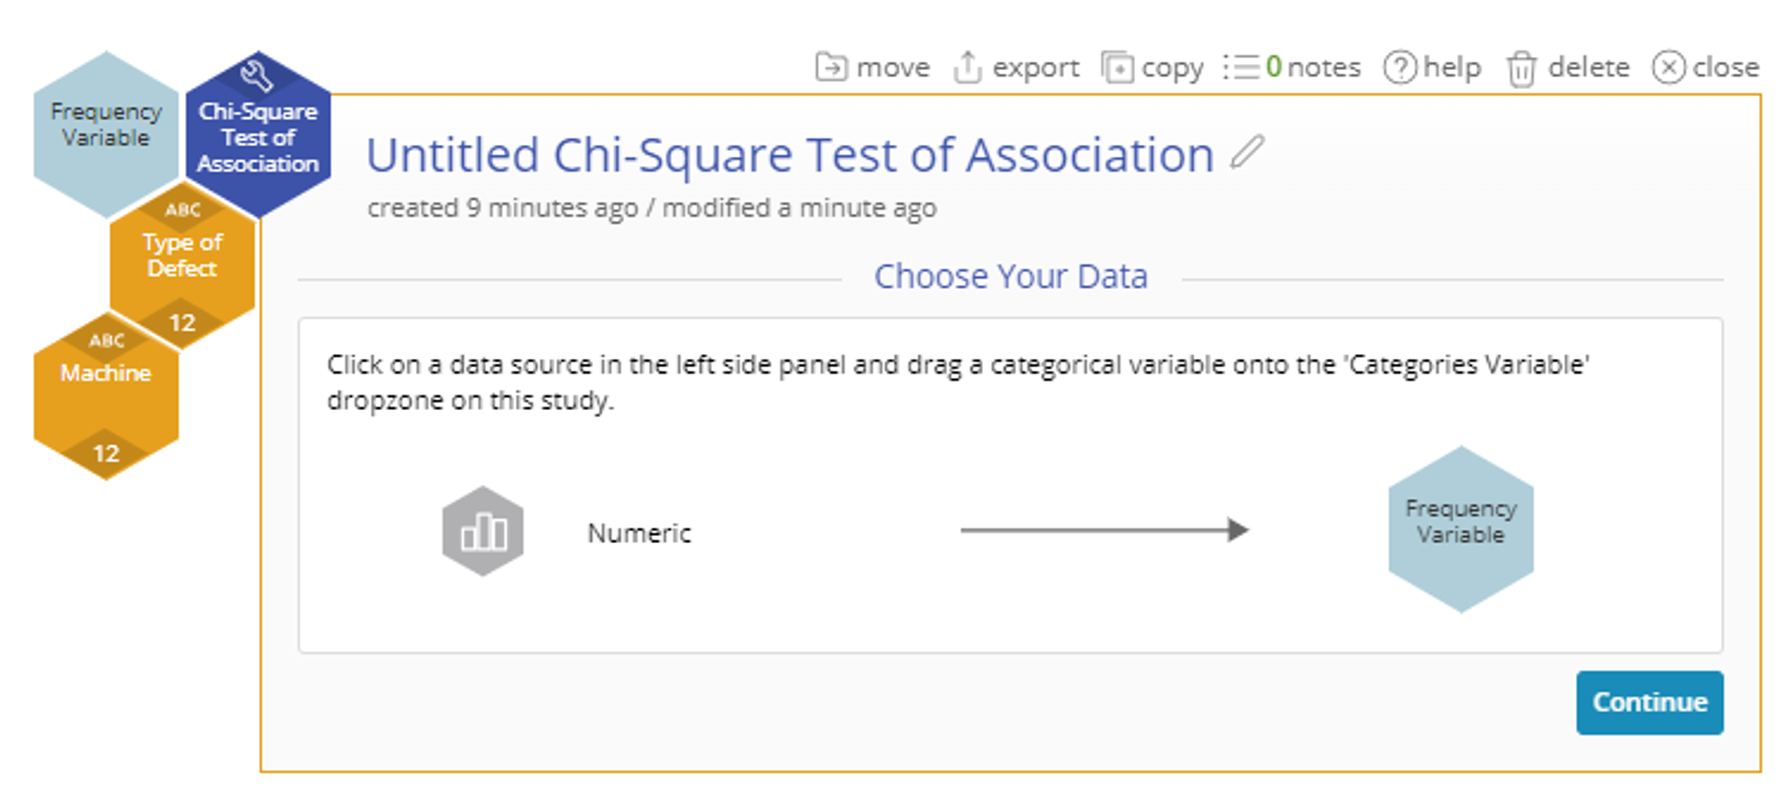
4. Click Continue - a Categorical Variables dropzone appears on the study. Drag Type of Defect onto the Categorical Variables dropzone.
5. Drag Machine onto the second Categorical Variables dropzone. Click Continue.
6. A Frequency Variable dropzone appears. Drag Counts onto the Frequency dropzone.
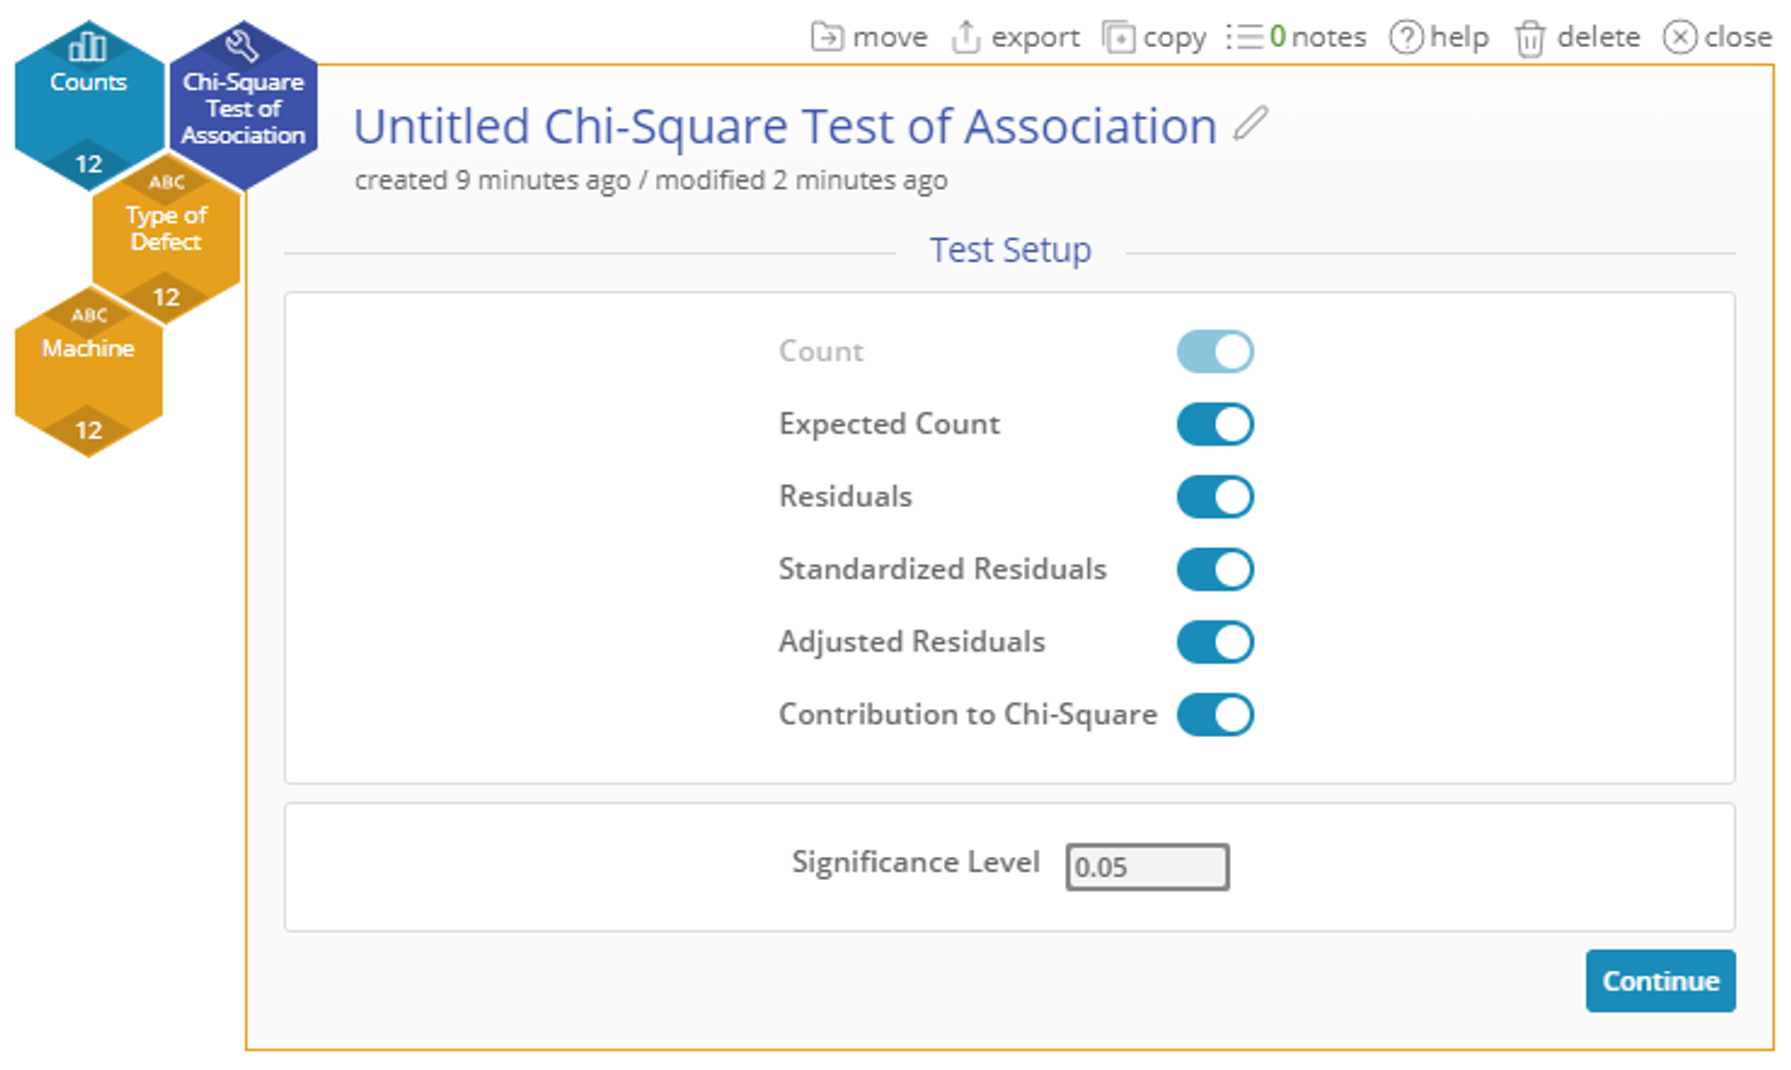
7. This screen also shows all the available Options for the output. Leave the options at their defaults. Click Continue to see the results.
Results
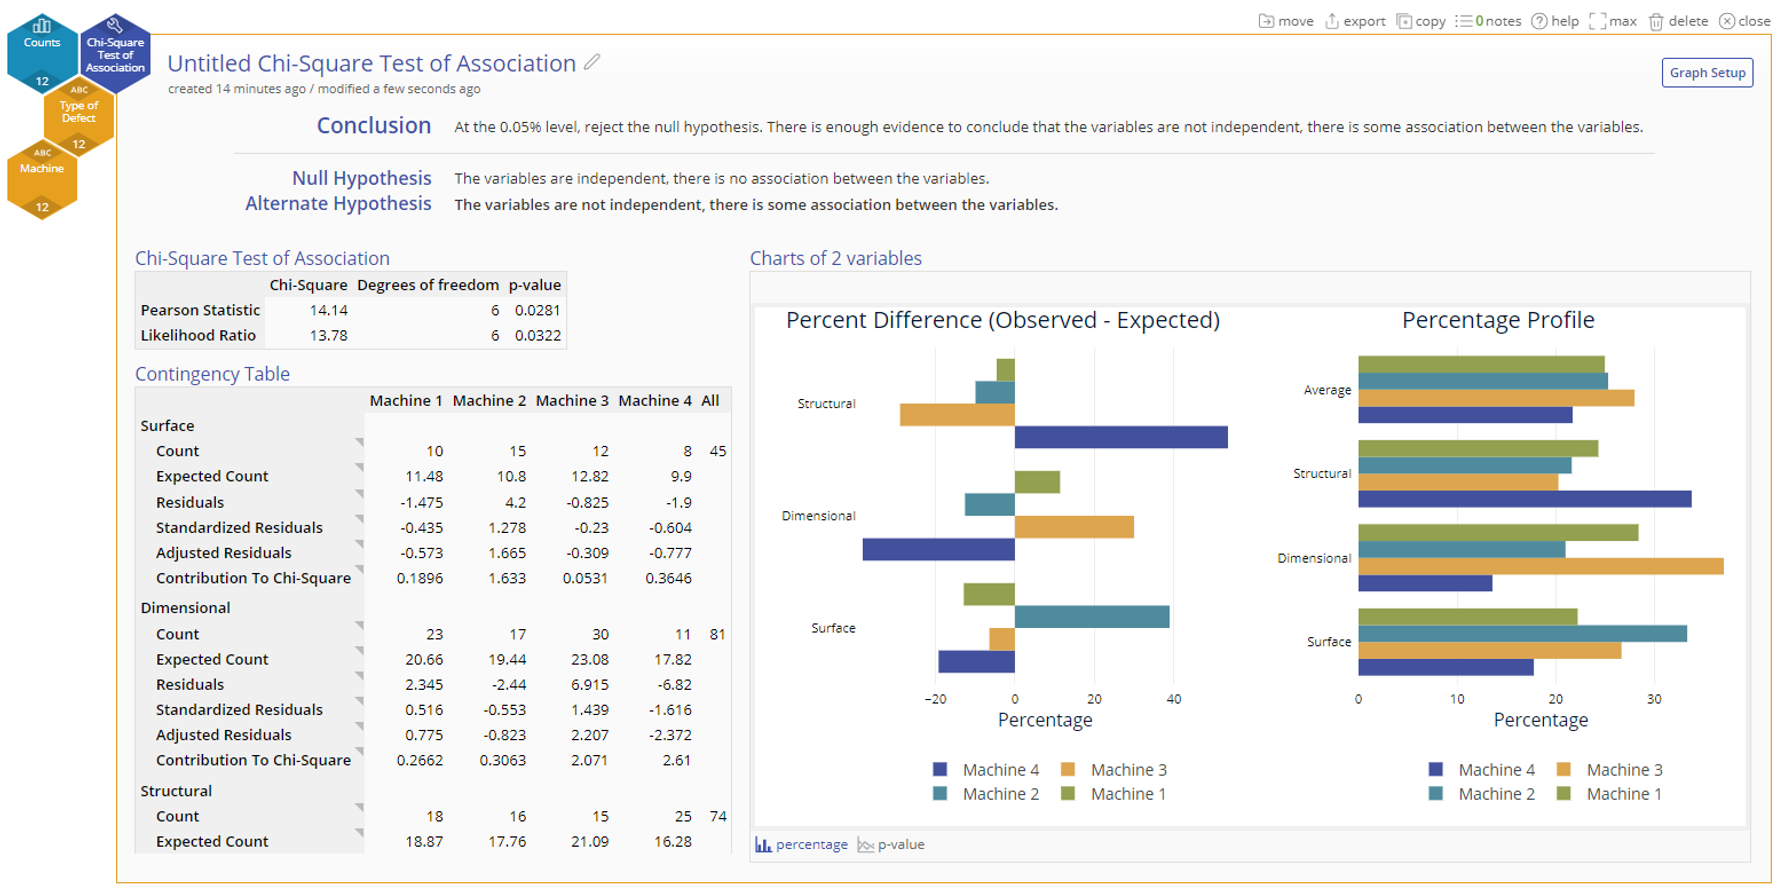
The results screen of the Chi-Square Test of Association includes the following:
- Conclusion Statement: A statement about whether or not the two categorical variables are associated (or alternatively, independent) at the chosen level of significance.
- Numeric Table Output: This section includes the Contingency Table along with any relevant statistics you selected. The cell with the maximum contribution to the Chi-Square test statistic across all categories is highlighted in gold while the cell with the minimum contribution is highlighted in blue.
- Graphical Output: These charts contain the visual representations of the data. The Percentage Profile plot is a visual representation of the observed percentages within each cell of the contingency table, allowing you to compare the distribution of categories across different levels of the two categorical variables being tested, essentially highlighting potential associations by visually showing how the percentages vary between groups. The %Difference (Observed - Expected) plot is a visual representation that shows, for each cell in a contingency table, the percentage difference between the actual observed count and the expected count based on the null hypothesis of no association between the variables, essentially highlighting where the largest discrepancies occur between what was observed and what would be expected if there was no relationship between the categories being analyzed. Large positive or negative percentage differences on the plot indicate significant deviations from the expected values under the null hypothesis, suggesting a potential association between the variables.
Was this helpful?

