
Multiple Proportions Test Tutorial
When to use this tool
Use the Multiple Proportions Test to compare the probability of occurrence of an event among three or more independent populations. An example would be to test whether the percent defective of a process differs across several (more than two) facilities or production lines.
The Multiple Proportions Test uses binary attribute data in the form of 0/1, success/failure, defective/non-defective, etc. in multiple samples. You can also perform this test if you have summary data of the form 'number of occurrences' and 'sample sizes' from the samples.
The test in EngineRoom employs the large sample approximation test based on the chi-square distribution, and the pooled estimate of the population proportion 'p' to estimate the standard error of the test statistic.
If a significant difference is found in the proportions using the overall test, the pairwise comparisons method called 'Marascuillo Procedure' is used to identify the specific pair/s of proportions which differ significantly.
The test makes the following assumptions:
- The data variables are binary.
- The units are randomly sampled.
- The data variables are independent of each other.
- The probability of the event ‘P’ is the same (constant) for all the units in the population.
Using EngineRoom
Select the Multiple Proportions test from the Parametric Test menu OR go through the steps in the Hypothesis Testing Wizard with binary data inputs.
Example:
Raw data
Your data should look something like this (the data can be text instead of numeric):

Use the broad steps outlined in the 1 Proportion test raw data example to run the test, or follow along with the tutorial video above to run the test using the raw data.
Summary data
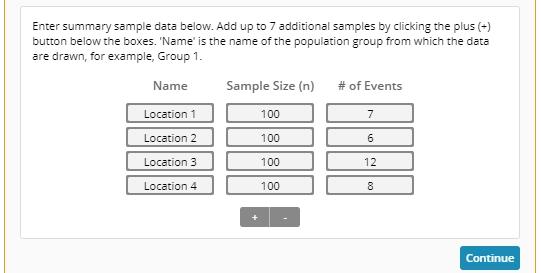
If you have summarized sample values (the sample sizes and proportions) for the groups, you can enter those values in the test setup dialog to run the test.
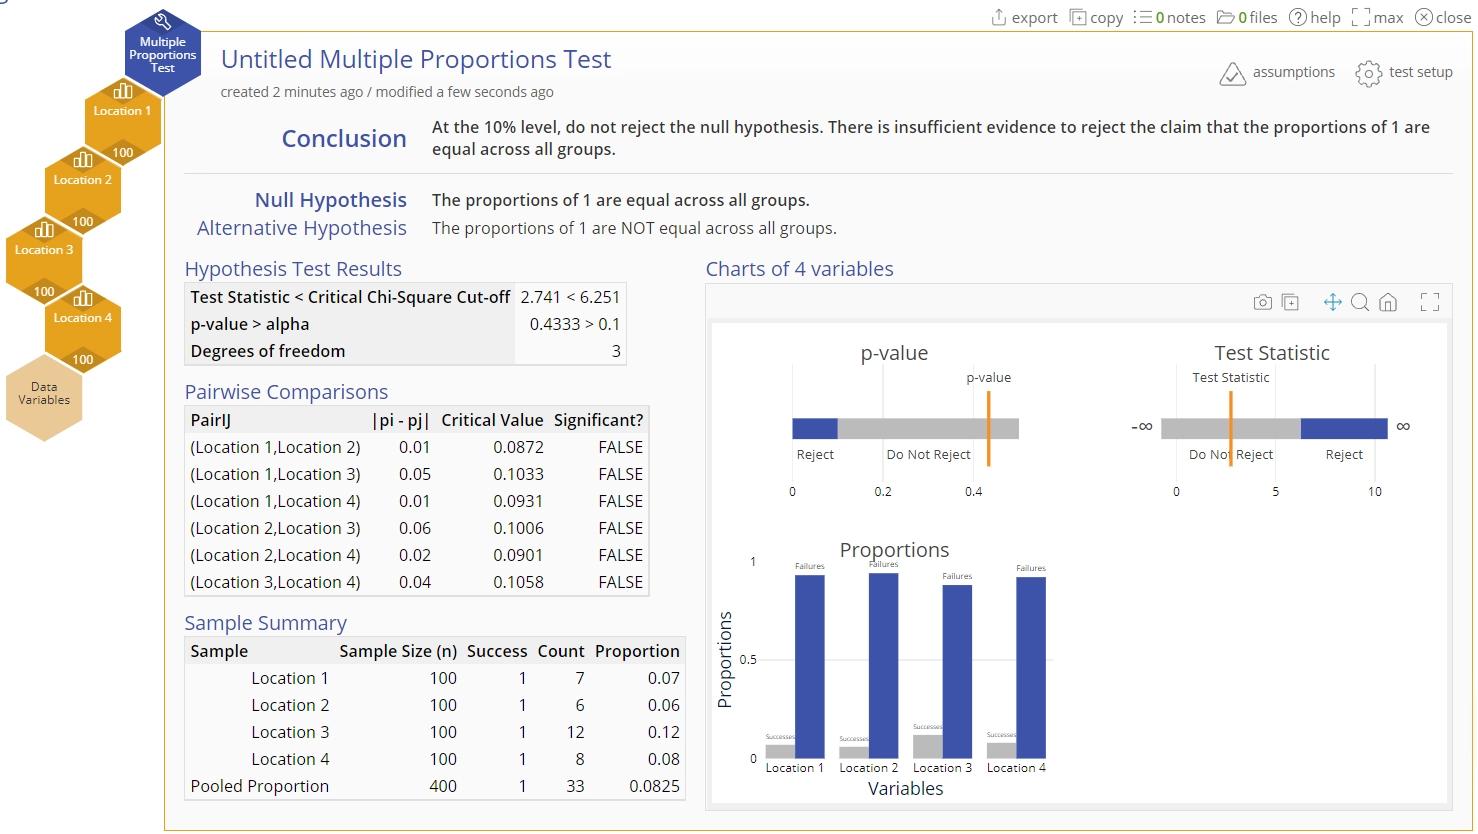
In this example, we're testing whether the proportion of lost customers (churn) is the same across a company's four locations, at the 10% level. Using the standalone test:
Steps:
- Open the Multiple Proportion Test study from the Parametric menu:
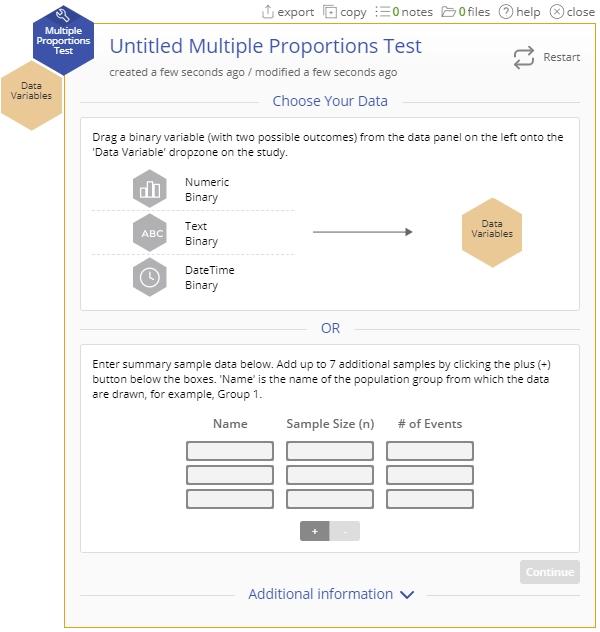
- Add a row to the summary data table by clicking on the '+' button below the table. Enter the summary data into the form and click Continue:
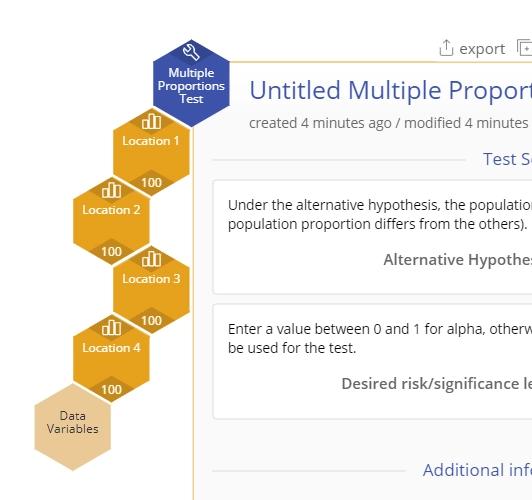
- OR You can drag the four Location variables onto the Data Variable drop zones on the study:
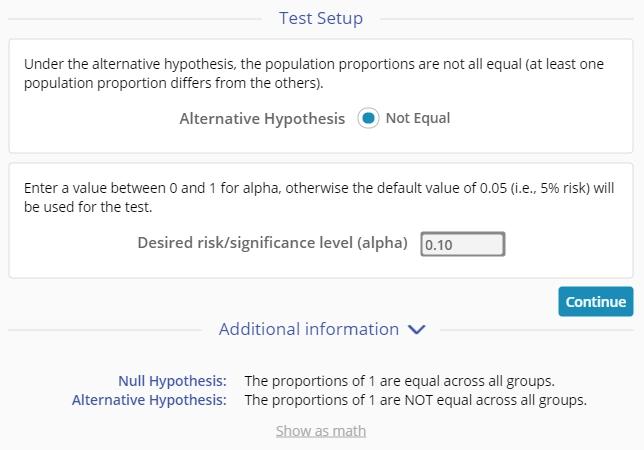
- Set up the test as shown and click Continue (Note: the only alternative hypothesis option for this test is 'Not Equal To'):
- The Multiple Proportions Test output using the actual data variables is shown (Note: the output based on summary sample data excludes the bar chart):
Multiple Proportions Test Video Tutorial
Was this helpful?