Linearity and Bias Study
When to use this tool
A Linearity and Bias Study is a key statistical analysis in Measurement System Analysis (MSA), designed to assess the accuracy and consistency of a measurement system over a range of part sizes or reference standards. Specifically, this study evaluates two critical aspects of measurement system performance:
- Bias: The difference between the measured value and the true value (reference standard) across different parts or standards. Bias measures the systematic error in the measurement system. A positive bias indicates the system consistently measures values higher than the true value, while a negative bias indicates the system measures lower than the true value.
- Linearity: The change in bias across the range of measurements. It examines whether the measurement system’s accuracy changes as the size of the parts or reference standards being measured increases or decreases. In other words, it helps determine whether the bias remains constant or varies across the measurement range.
Using EngineRoom
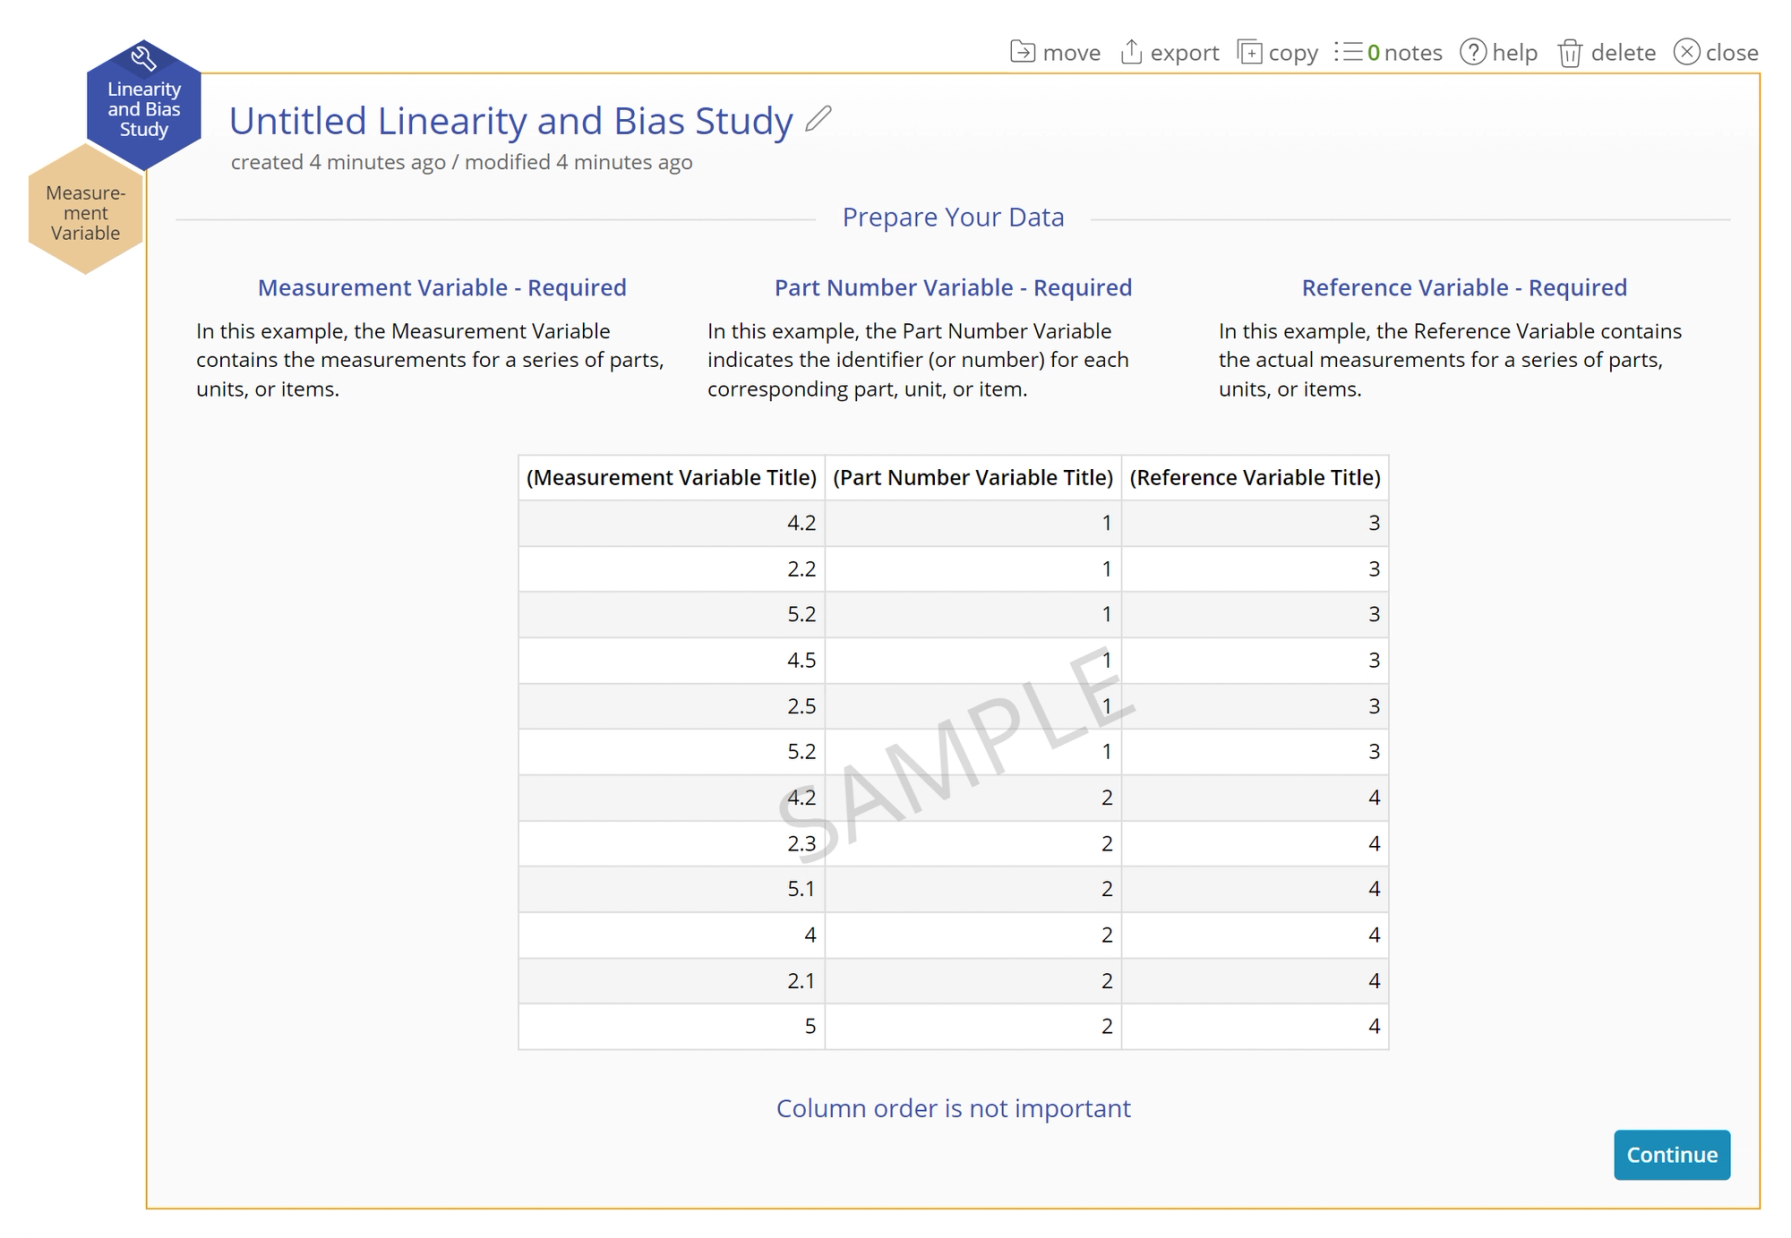
In the DMAIC menu, select Measure > Measurement System Analysis (MSA)... > Linearity and Bias. (In the Standard menu, select the tool under Quality Tools). The study opens on the workspace. It begins with a sample of what a good data set for this tool looks like.
There are three hexagons or 'drop zones' attached to the study:
- Measurement Variable (Required): This variable contains the measurements for the parts
- Part Number Variable (Required): This variable contains the labels for the unique parts used in the study
- Reference Variable (Required): This variable contains the associated reference (true) value for a given part. This will be repeated for each measurement.
Example:
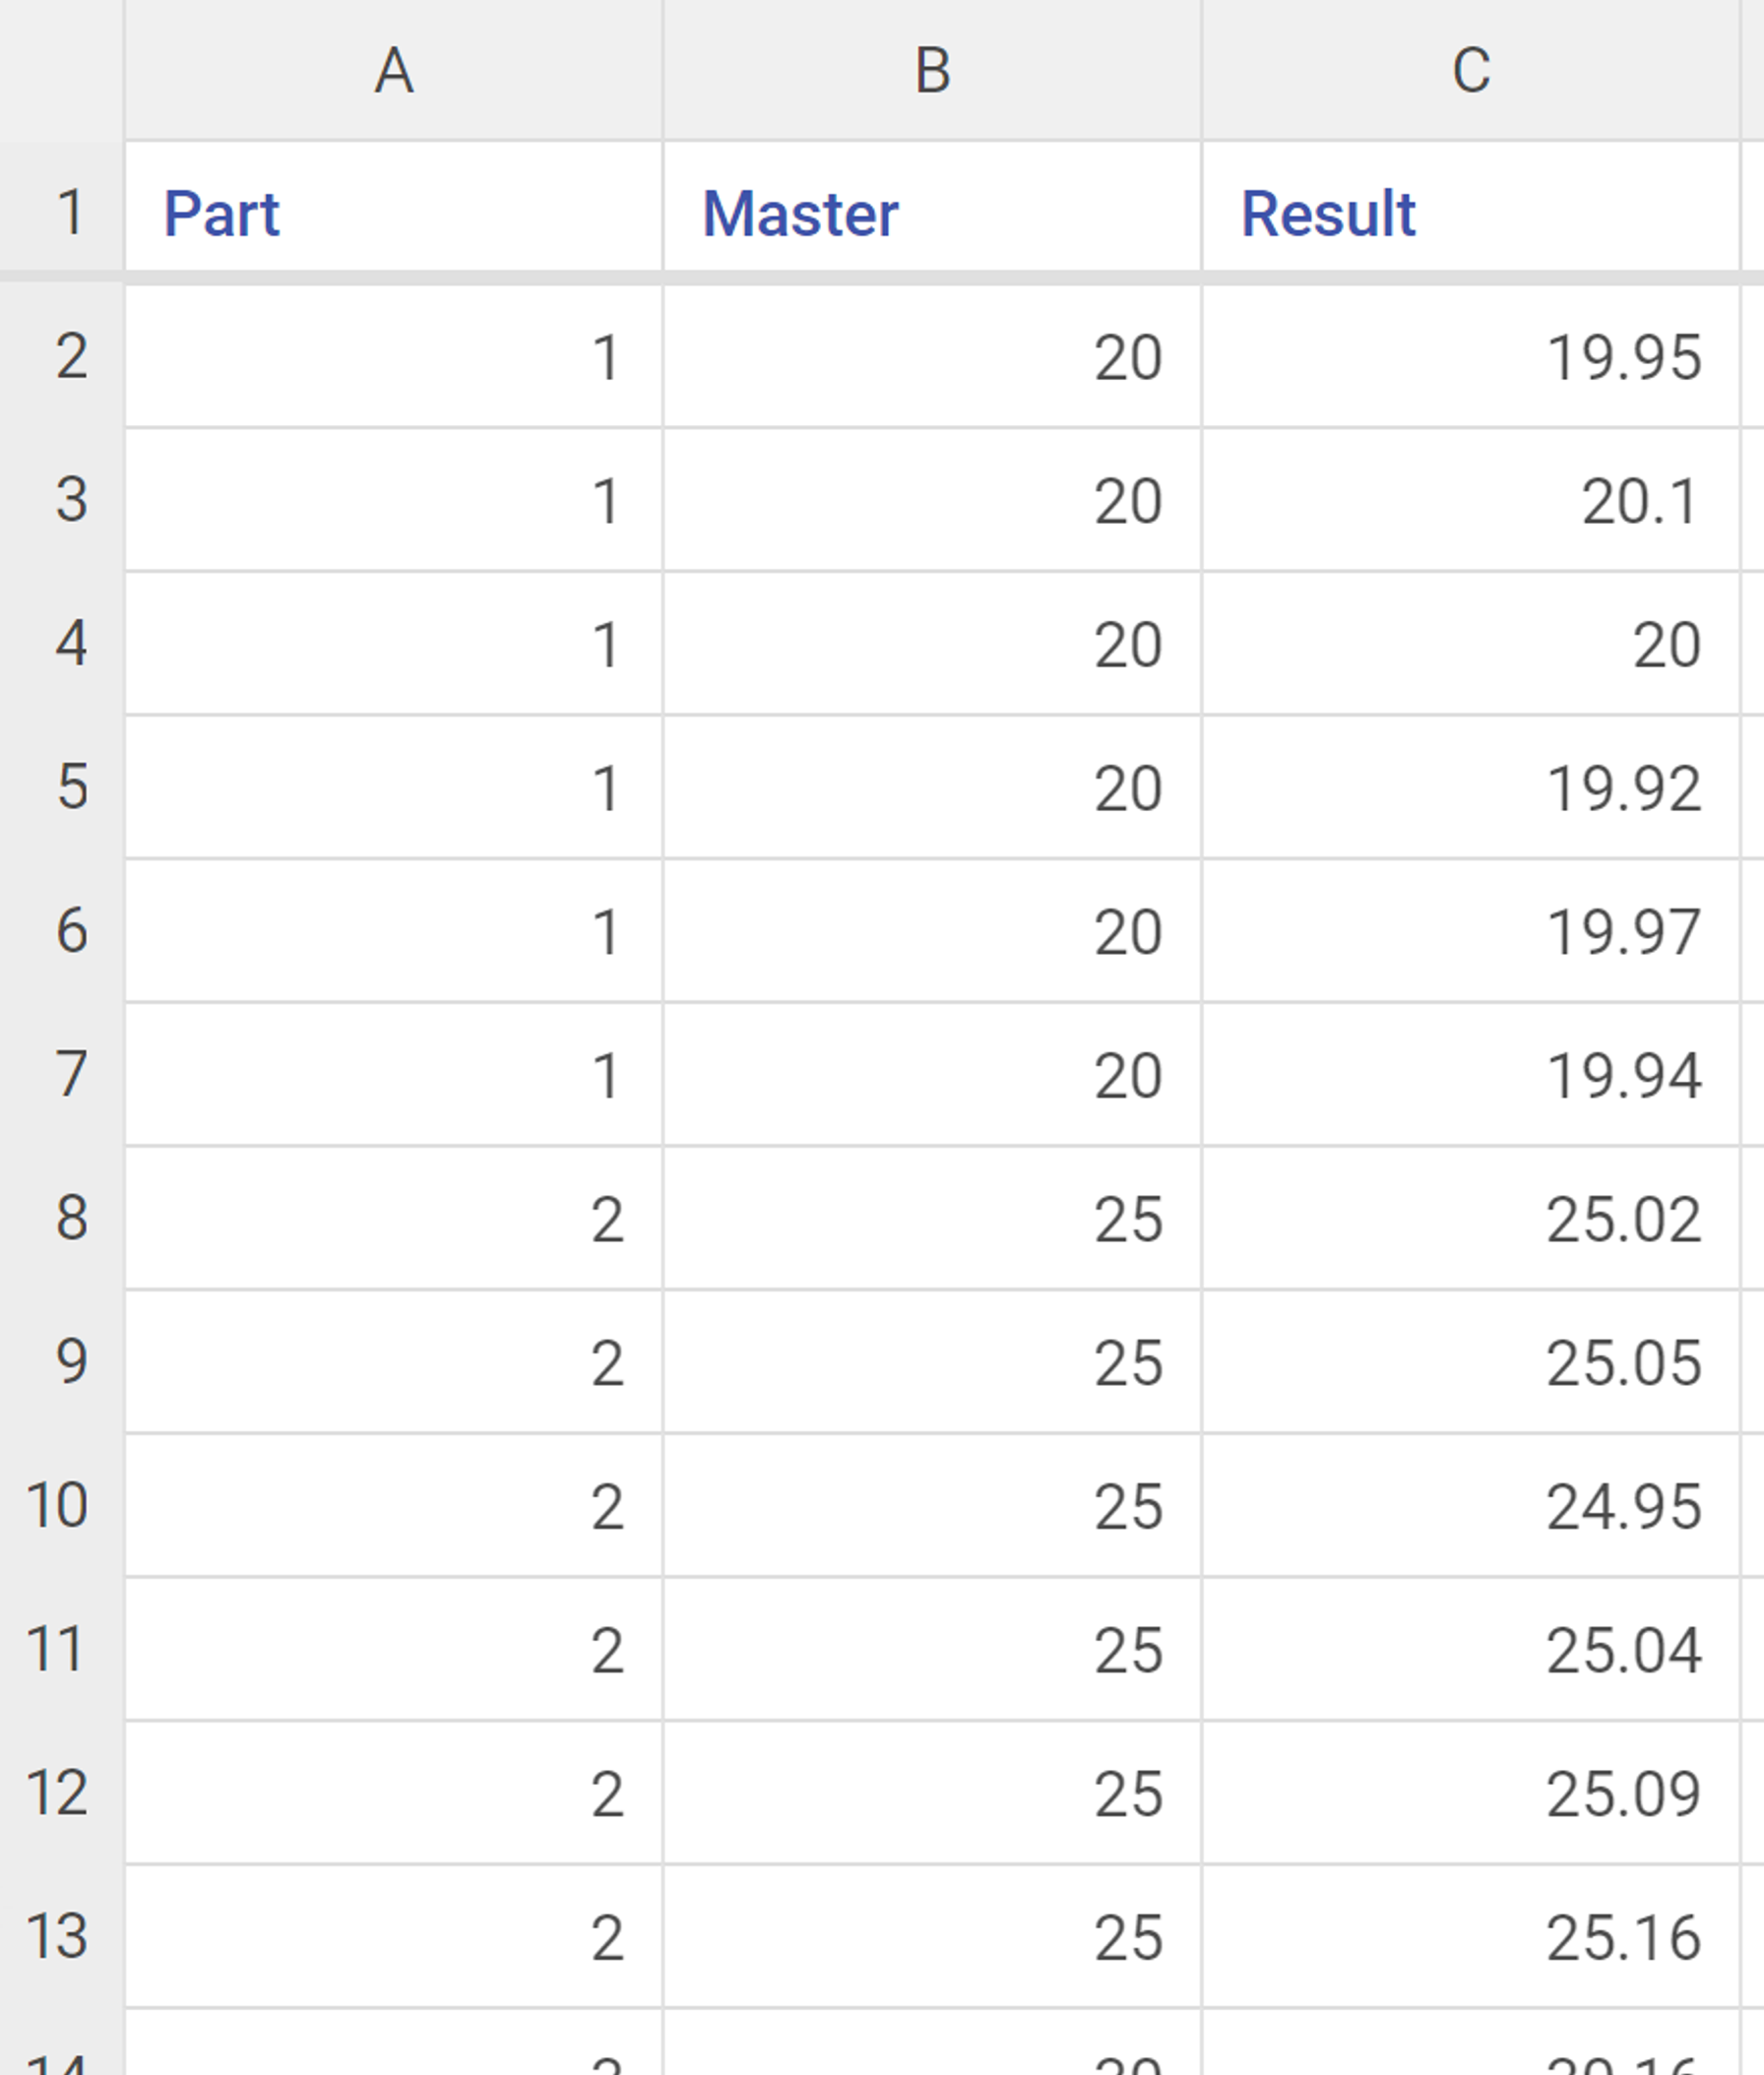
You are a quality engineer at a precision machining company that manufactures cylindrical parts for the automotive industry. One of the critical dimensions in the manufacturing process is the diameter of a cylindrical part used in a high-performance fuel injection system, which must be measured accurately across a range of sizes. Given the importance of this component, it's vital to ensure that the measuring device used to inspect this feature is both accurate and repeatable.
Steps:
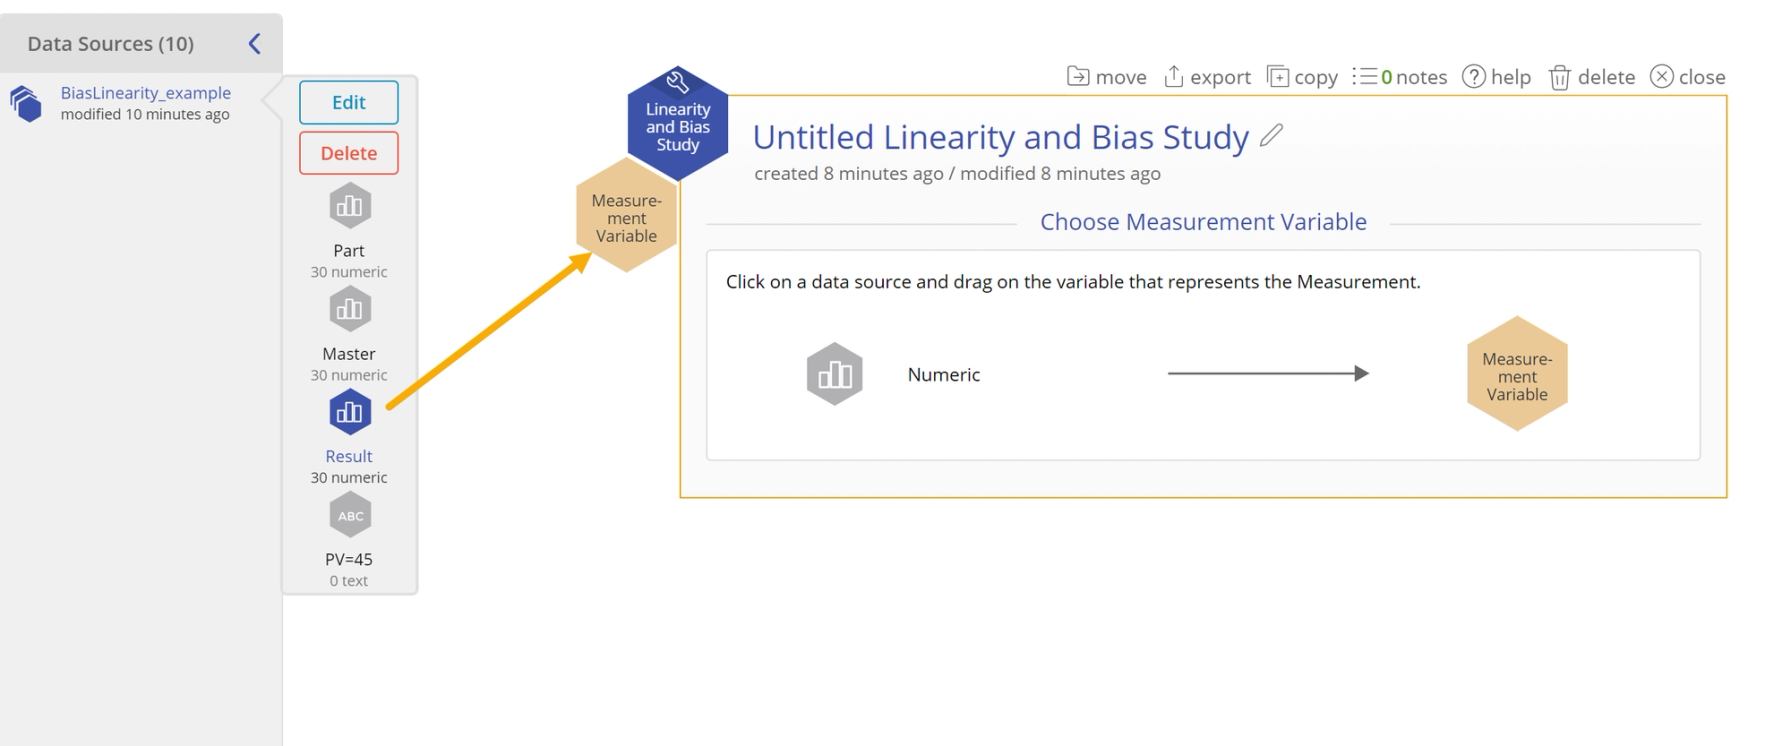
1. Go to Measure > Measurement System Analysis (MSA) in the DMAIC menu (or Quality Tools in the Standard menu) and open the Linearity and Bias Study tool onto the workspace. Click Continue.
2. Upload the data source. Click on the data source and drag the variable Result onto the Measurement Variable hexagon.
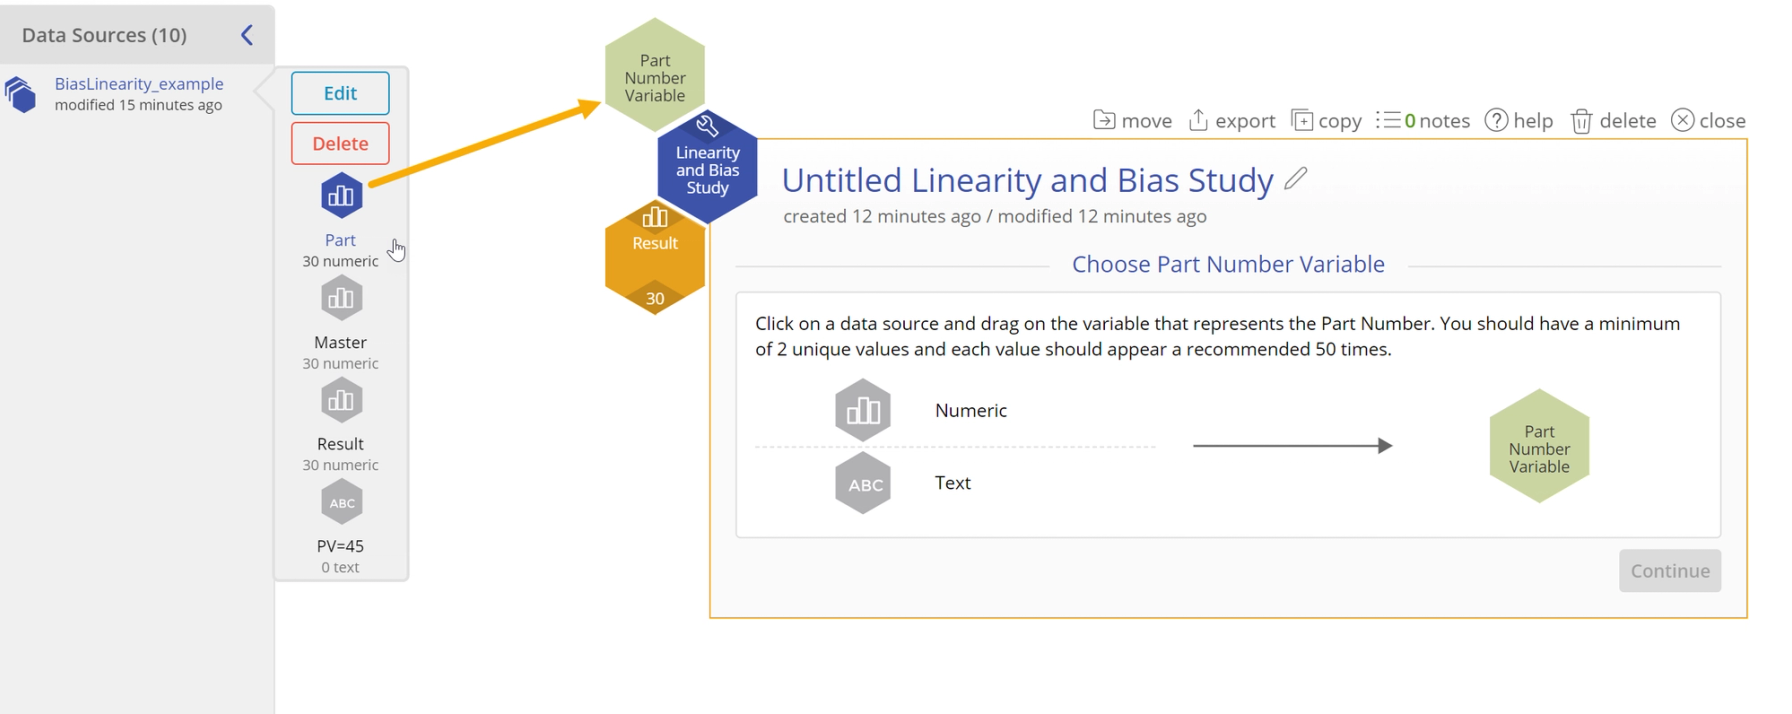
3. Drag the variable called Part onto the Part Number Variable.
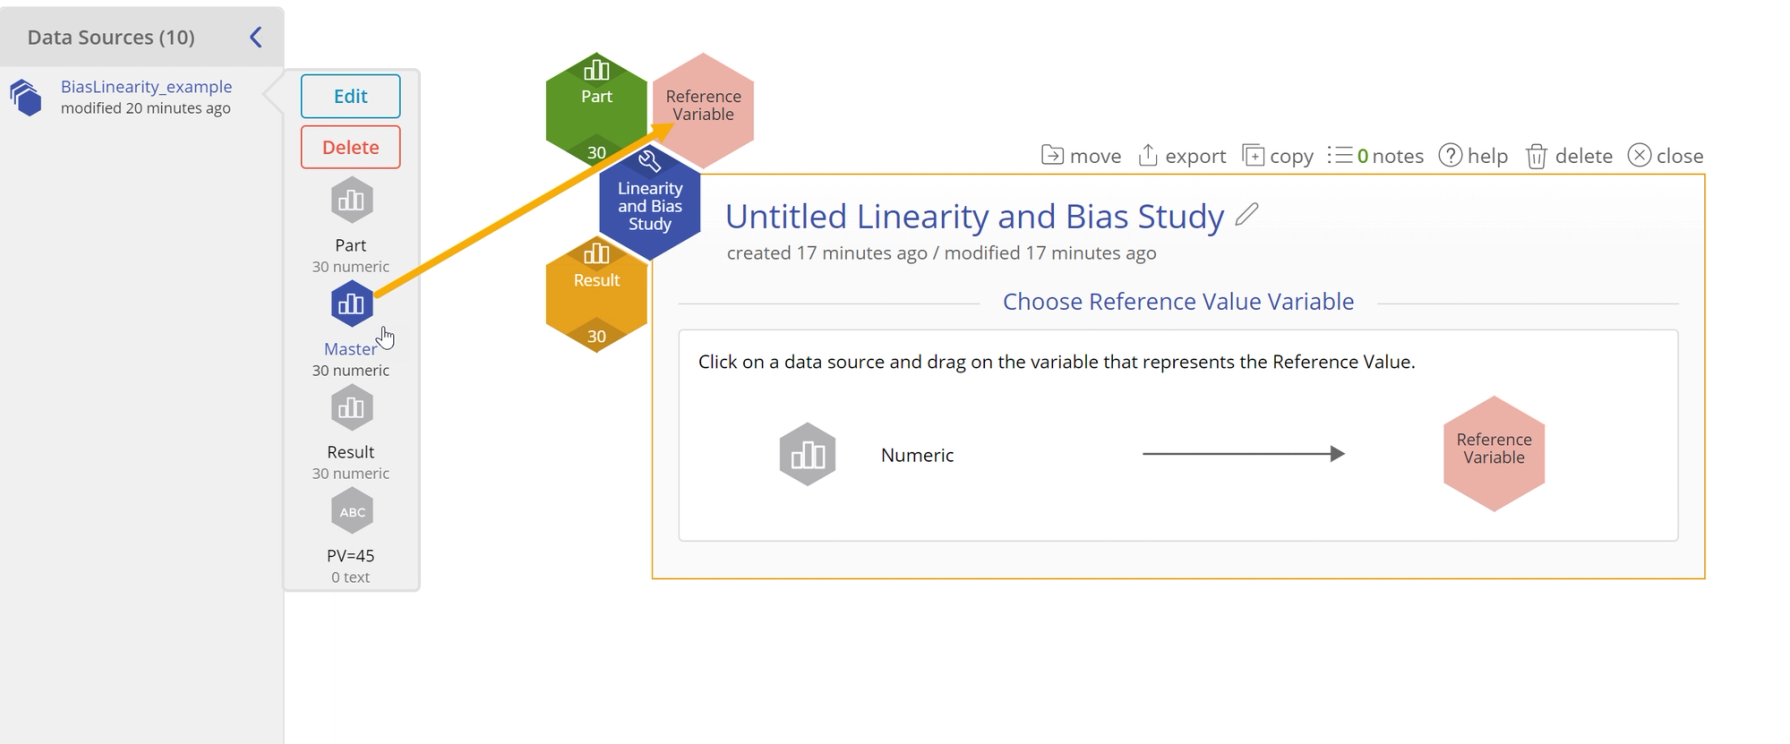
4. Drag the variable called Master onto the Reference Variable.
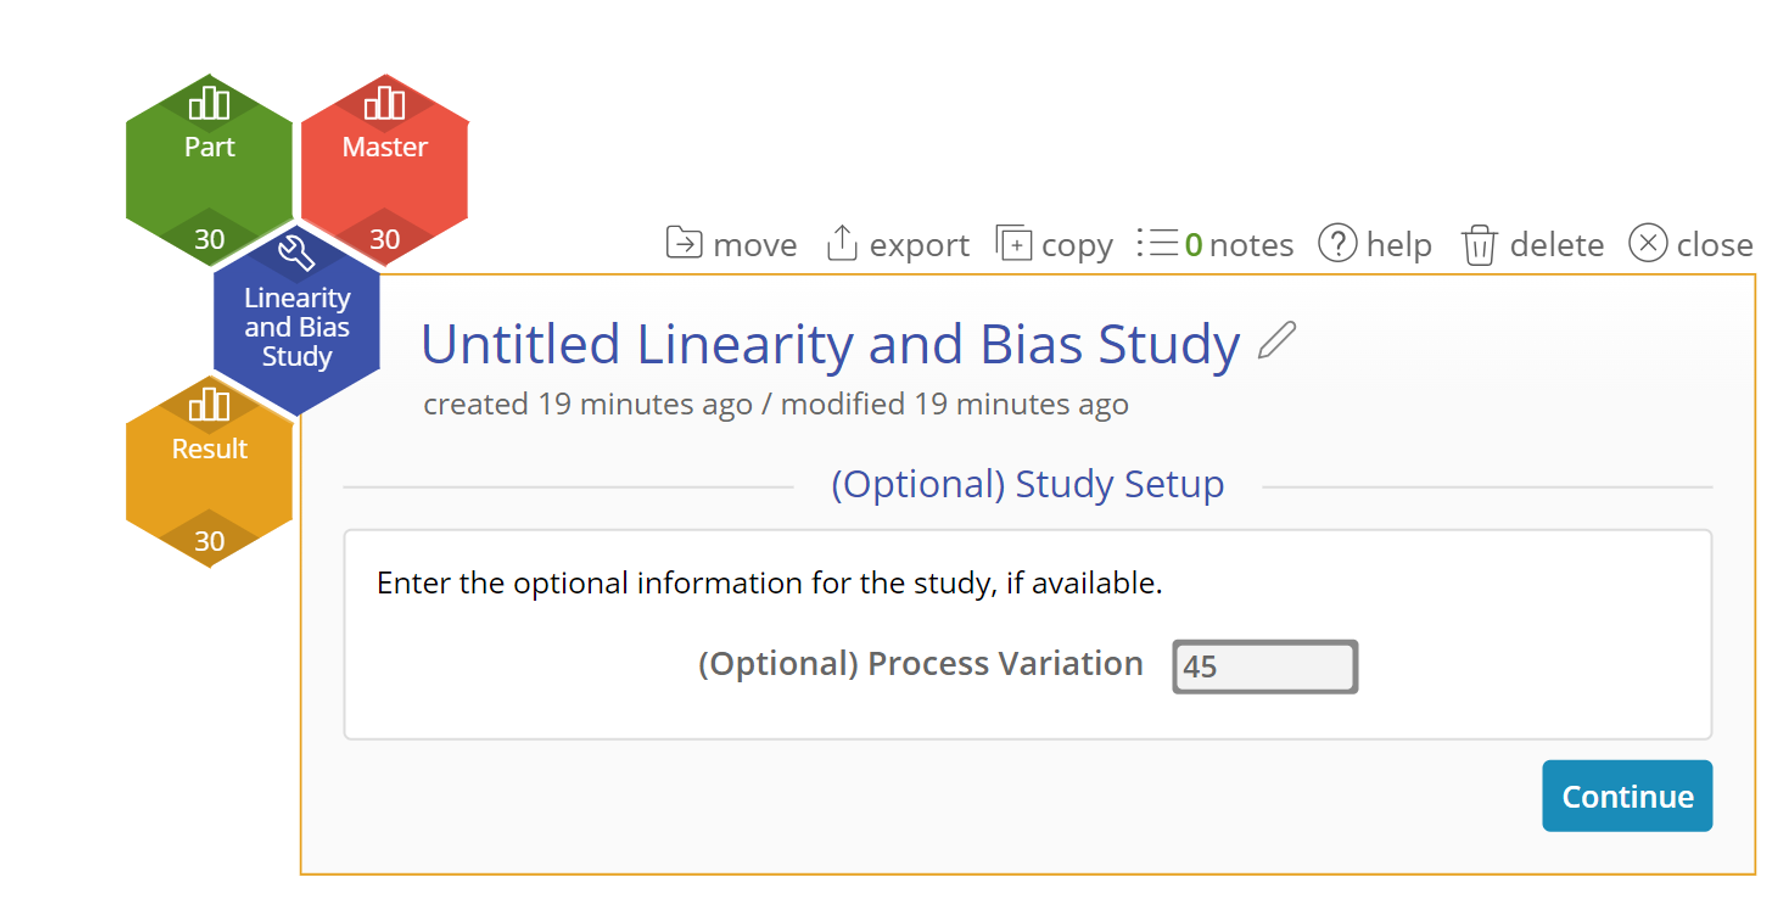
5. Input the known Process Variation if you have that information. This is typically 6 times the historical standard deviation of the process. In this case, our value is 45. Click Continue.
5. View and interpret the results.
Results:
The Linearity and Bias Study output includes graphical and numeric output:
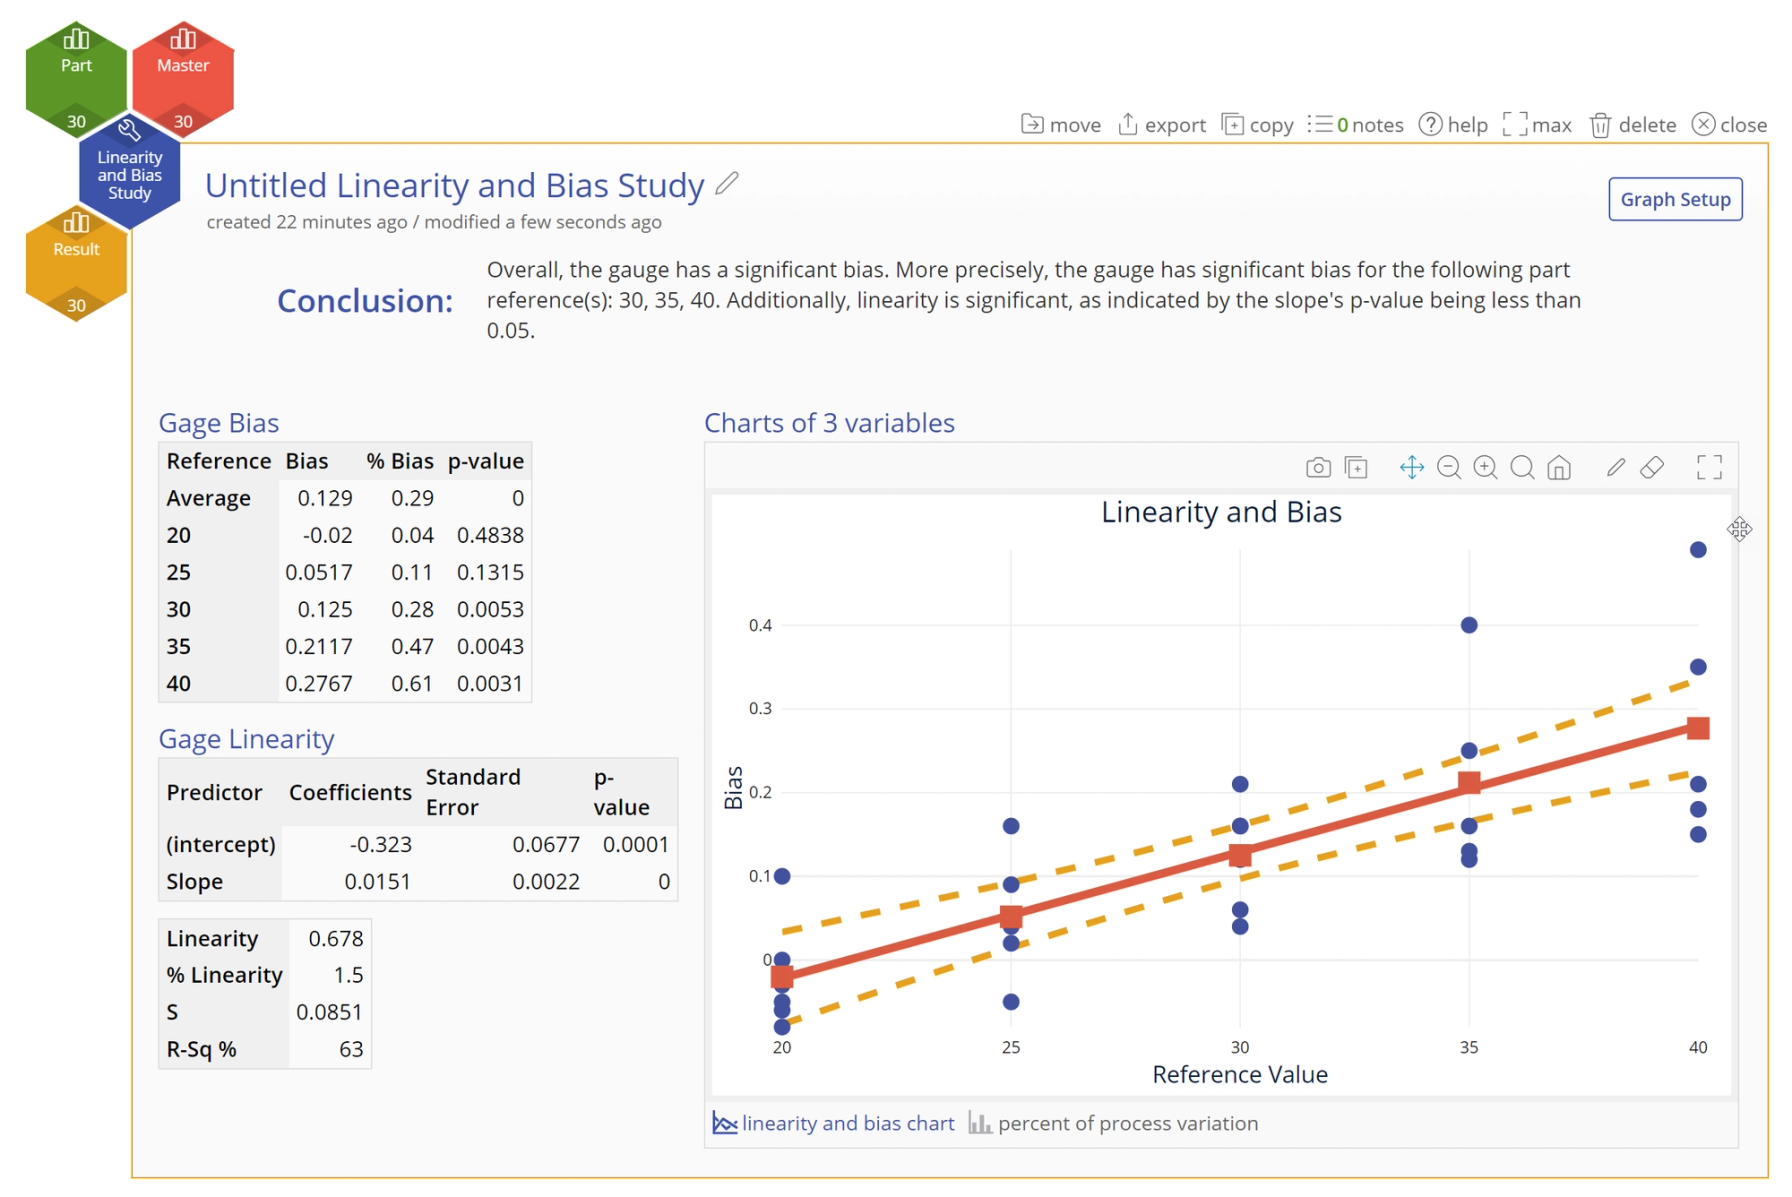
1. The conclusion statement at the top summarizes the key findings of the analysis, indicating whether the bias is significant for the gauge overall, whether any of the part references in the range have significant bias, and whether or not the linearity of bias is significant.
2. The graphical output contains a scatter plot with a regression line running through that shows the bias of each measured value against its reference value. The regression line is sloped if there is significant linearity.
3. The numeric output contains:
- Gauge Bias - This table tells the user about the calculated difference between the measured values and the expected values. It starts with the average across all parts, and then breaks down each part individually. This is a t-test of the null hypothesis that the mean Bias = 0. A p-value smaller than the entered significance (alpha) level rejects the null hypothesis and concludes that there is significant bias (or lack of accuracy) in the measurement instrument. If significant, the mean bias indicates how much higher (if positive) or lower (if negative) than the reference value the gauge is measuring.
- Gauge Linearity - This calculates the intercept and slope of the line that connects the low reference value of the range to the high reference value of the range. It contains a p-value for the slope of the line to indicate whether linearity is significant or not for this gauge.
- Model Summary - This last table lists the statistics for Linearity as well as final statistics.
Was this helpful?

