
VDA5 Gauge R&R Tutorial
When to use this tool
The VDA 5 Gauge R&R Tool is designed to help you evaluate the reliability and precision of your measurement system in accordance with the VDA 5 standard—widely used in the automotive industry and other high-precision manufacturing sectors. Unlike traditional Gauge R&R methods, VDA 5 takes into account measurement uncertainty and tolerance-based evaluations, offering a more robust and traceable assessment.
Using EngineRoom
Note: the chart demonstration below has the Guided Mode disabled, so it combines some steps in one dialog box. You can enable or disable Guided Mode from the User menu on the top right of the EngineRoom workspace.
To use the tool, in the DMAIC menu select Measure > Measurement System Analysis (MSA)... > VDA5 > VDA5 Gauge R&R (In the Standard menu, select the tool under Quality Tools > VDA5). The study opens on the workspace:
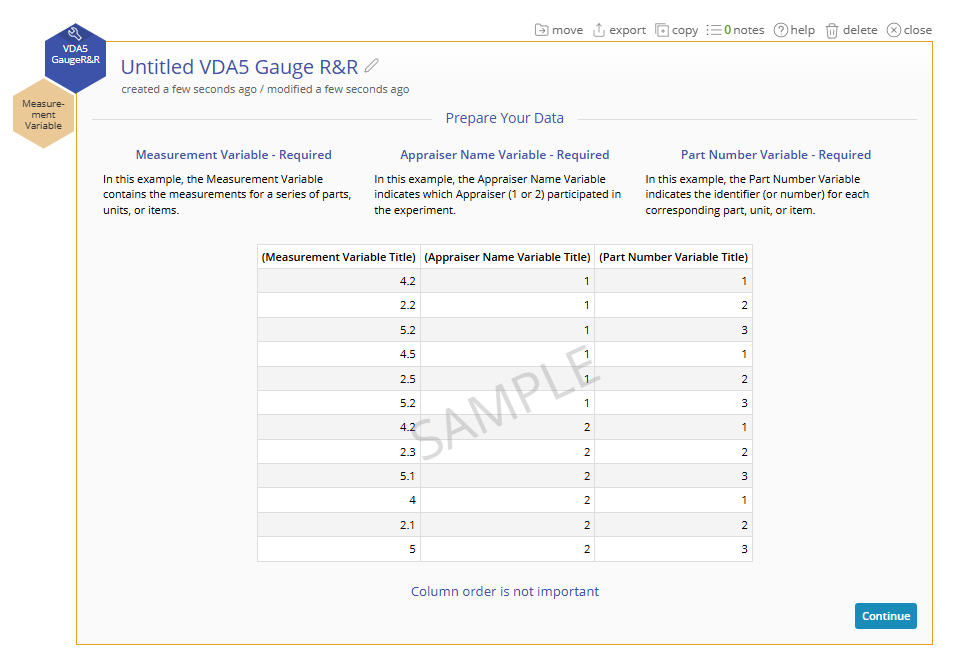
There are three hexagons or 'drop zones' attached to the study:
- Measurement Variable (required): used for the variable containing the measurement data from the study. Must be numeric.
- Appraiser Name Variable (required): used for the variable identifying the operator names. Can be numeric or text.
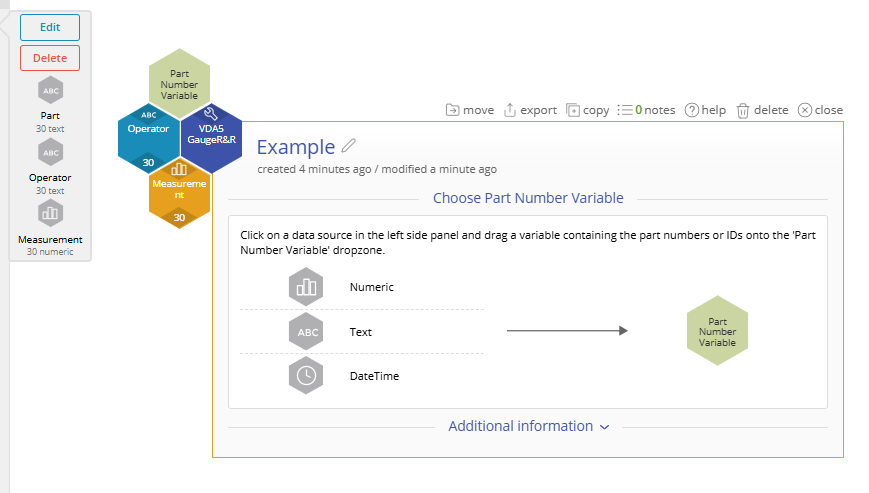
- Part Number Variable (required): used for the variable containing the part numbers. Can be numeric or text.
Example:
A manufacturing plant produces metal components that require tight dimensional control. One critical dimension—the outer diameter—has a nominal specification of 50.00 mm, with a process tolerance of ±0.5 mm (acceptable range: 49.5 mm to 50.5 mm).
To ensure consistent quality, the quality team performs a VDA 5 Gauge R&R study to evaluate whether the measurement system (a digital micrometer) is capable of accurately and consistently measuring this dimension.
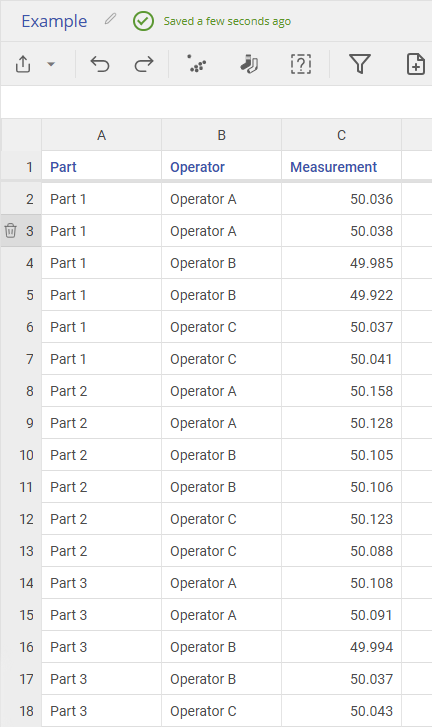
Open the data source to see three column of data: Part (containing the part numbers), Operator (containing the names of the three appraisers) and Measurement (containing the measurement data gathered by the three appraisers). Each part number is repeated three times for each appraiser, representing the three trials.
Steps:
1. Go to Measure > Measurement System Analysis (MSA) > VDA5 and open the VDA5 Gauge R&R tool onto the workspace.
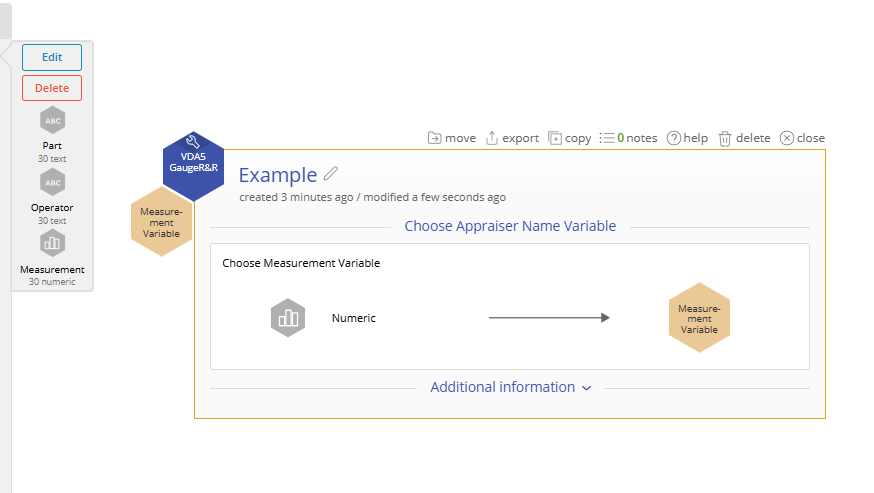
2. Navigate to the data source and drag Measurement onto the Measurement Variable hexagon.
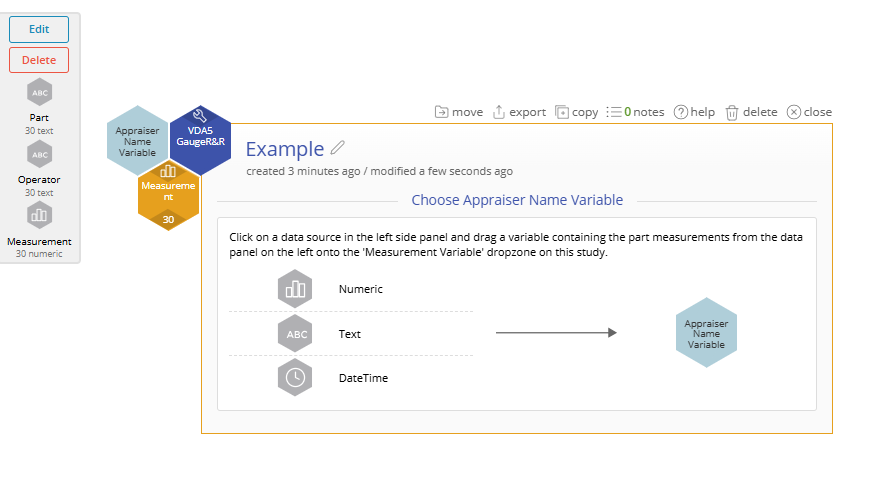
3. Drag Operator onto the Appraiser Name Variable hexagon.
4. Click on the data source and drag Part onto the Part Number Variable hexagon.
5. Customize the study options to your requirements (all are optional):
- Enter a lower specification limit and/or
- Enter an upper specification limit
- OR instead enter the tolerance range (upper minus lower specification). For this example enter the tolerance range as 1.2 (obtained from +/-0.6)
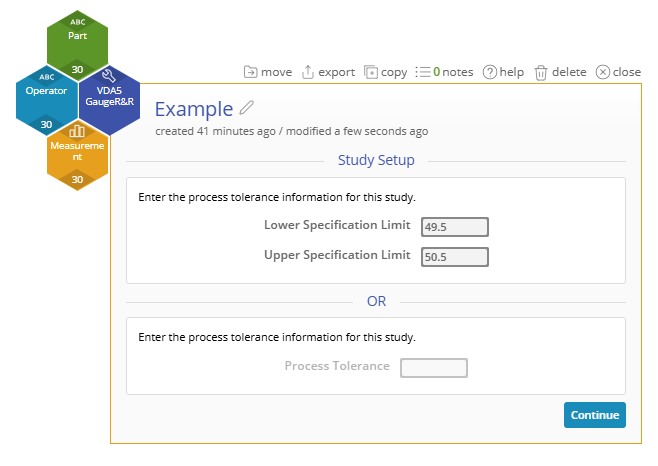
6. Click Continue.
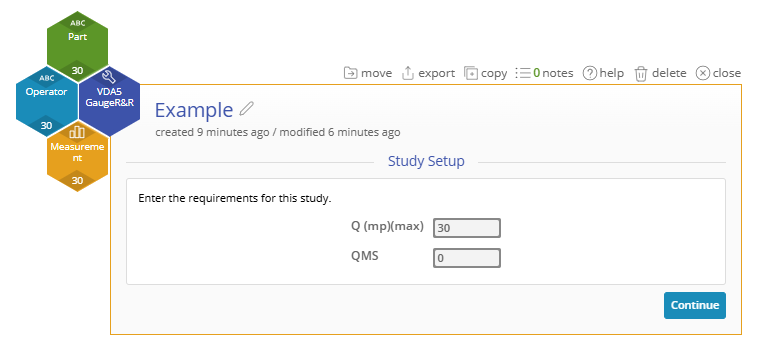
7. Specify the Q(mp)(max) and the QMS of your process. The QMS can be obtained from the VDA5 Prestudy.
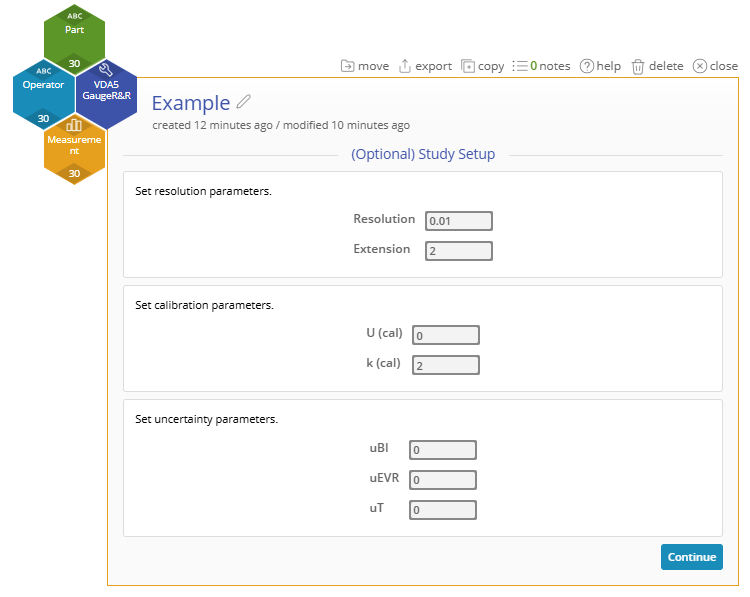
8. Set any additional parameters. These parameters are optional and have acceptable defaults.
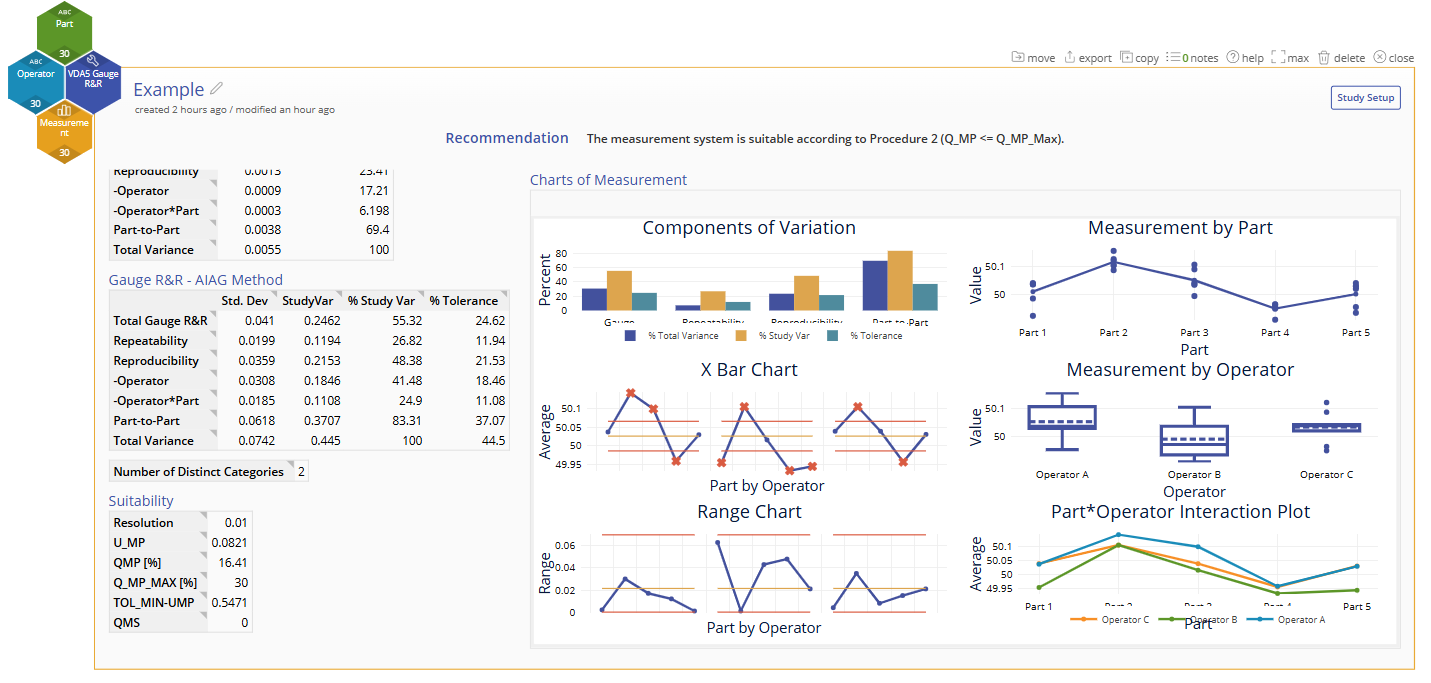
Results:
The Gauge R&R output includes graphical and numeric output:
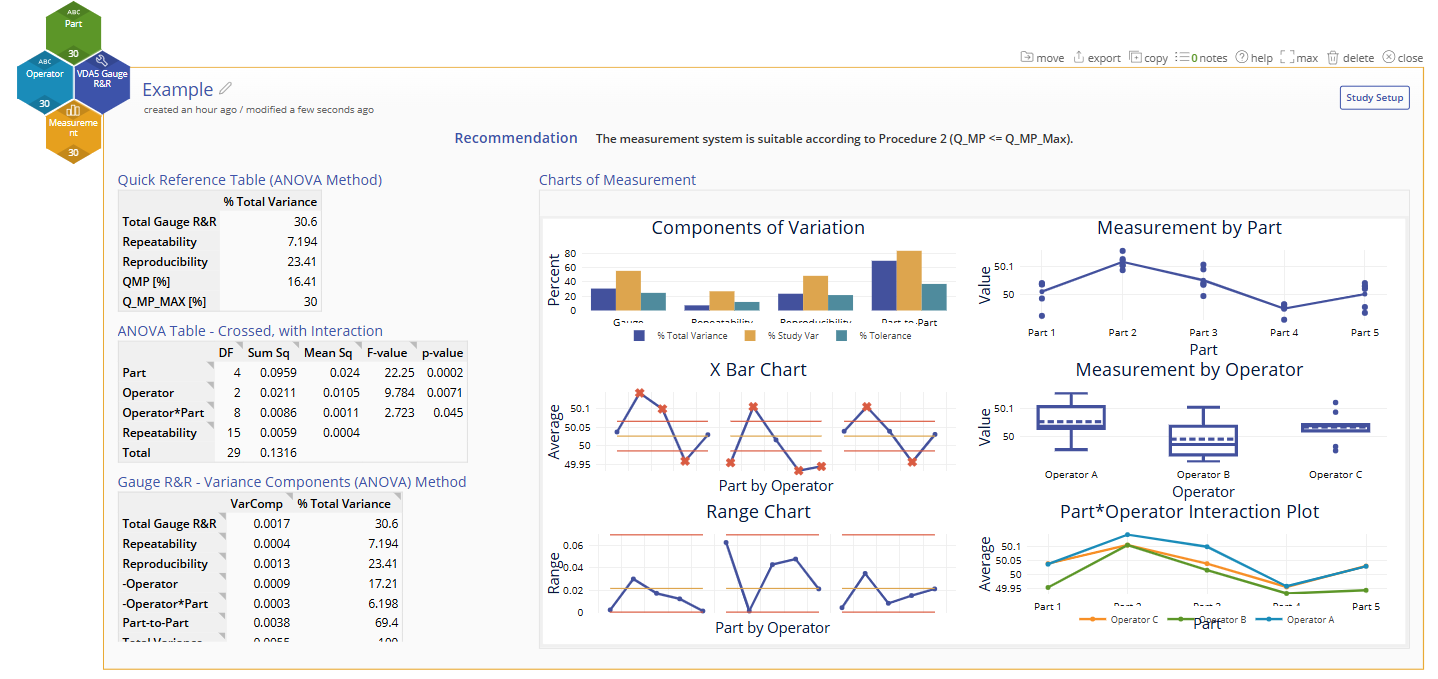
After scrolling down the left side:
The recommendation at the top summarizes the key findings of the analysis and are displayed in the Quick Reference Table.
The graphical output contains:
- Components of Variation bar chart
- Xbar Chart (you want to see at least 50% of the points falling outside the control limits on this chart)
- Range Chart (you want to see points falling within the control limits on this chart)
- Data by Parts chart
- Data by Appraisers chart
- Parts by Appraisers Interaction Chart
The table output includes the relevant statistics for the VDA5 standard.
Tutorial
Coming Soon
Was this helpful?