Friedman Test Tutorial
When to use this tool
The Friedman Test is used to compare the medians of three or more related, continuous populations. As an example, four drugs are compared with respect to their effect on the reaction time to a certain stimulus of 10 subjects. The drugs are the treatments under study, but the subjects are the blocks because they contribute variability to the study which needs to be accounted for.
The Friedman test makes the following assumptions:
- The data are continuous numeric.
- The units are randomly sampled.
- The treatments and blocks do not interact with each other.
- The groups have equal variances.
Using EngineRoom
Note: You must have raw data to run this test. Non-parametric tests cannot be run with sample summary data.
Example:
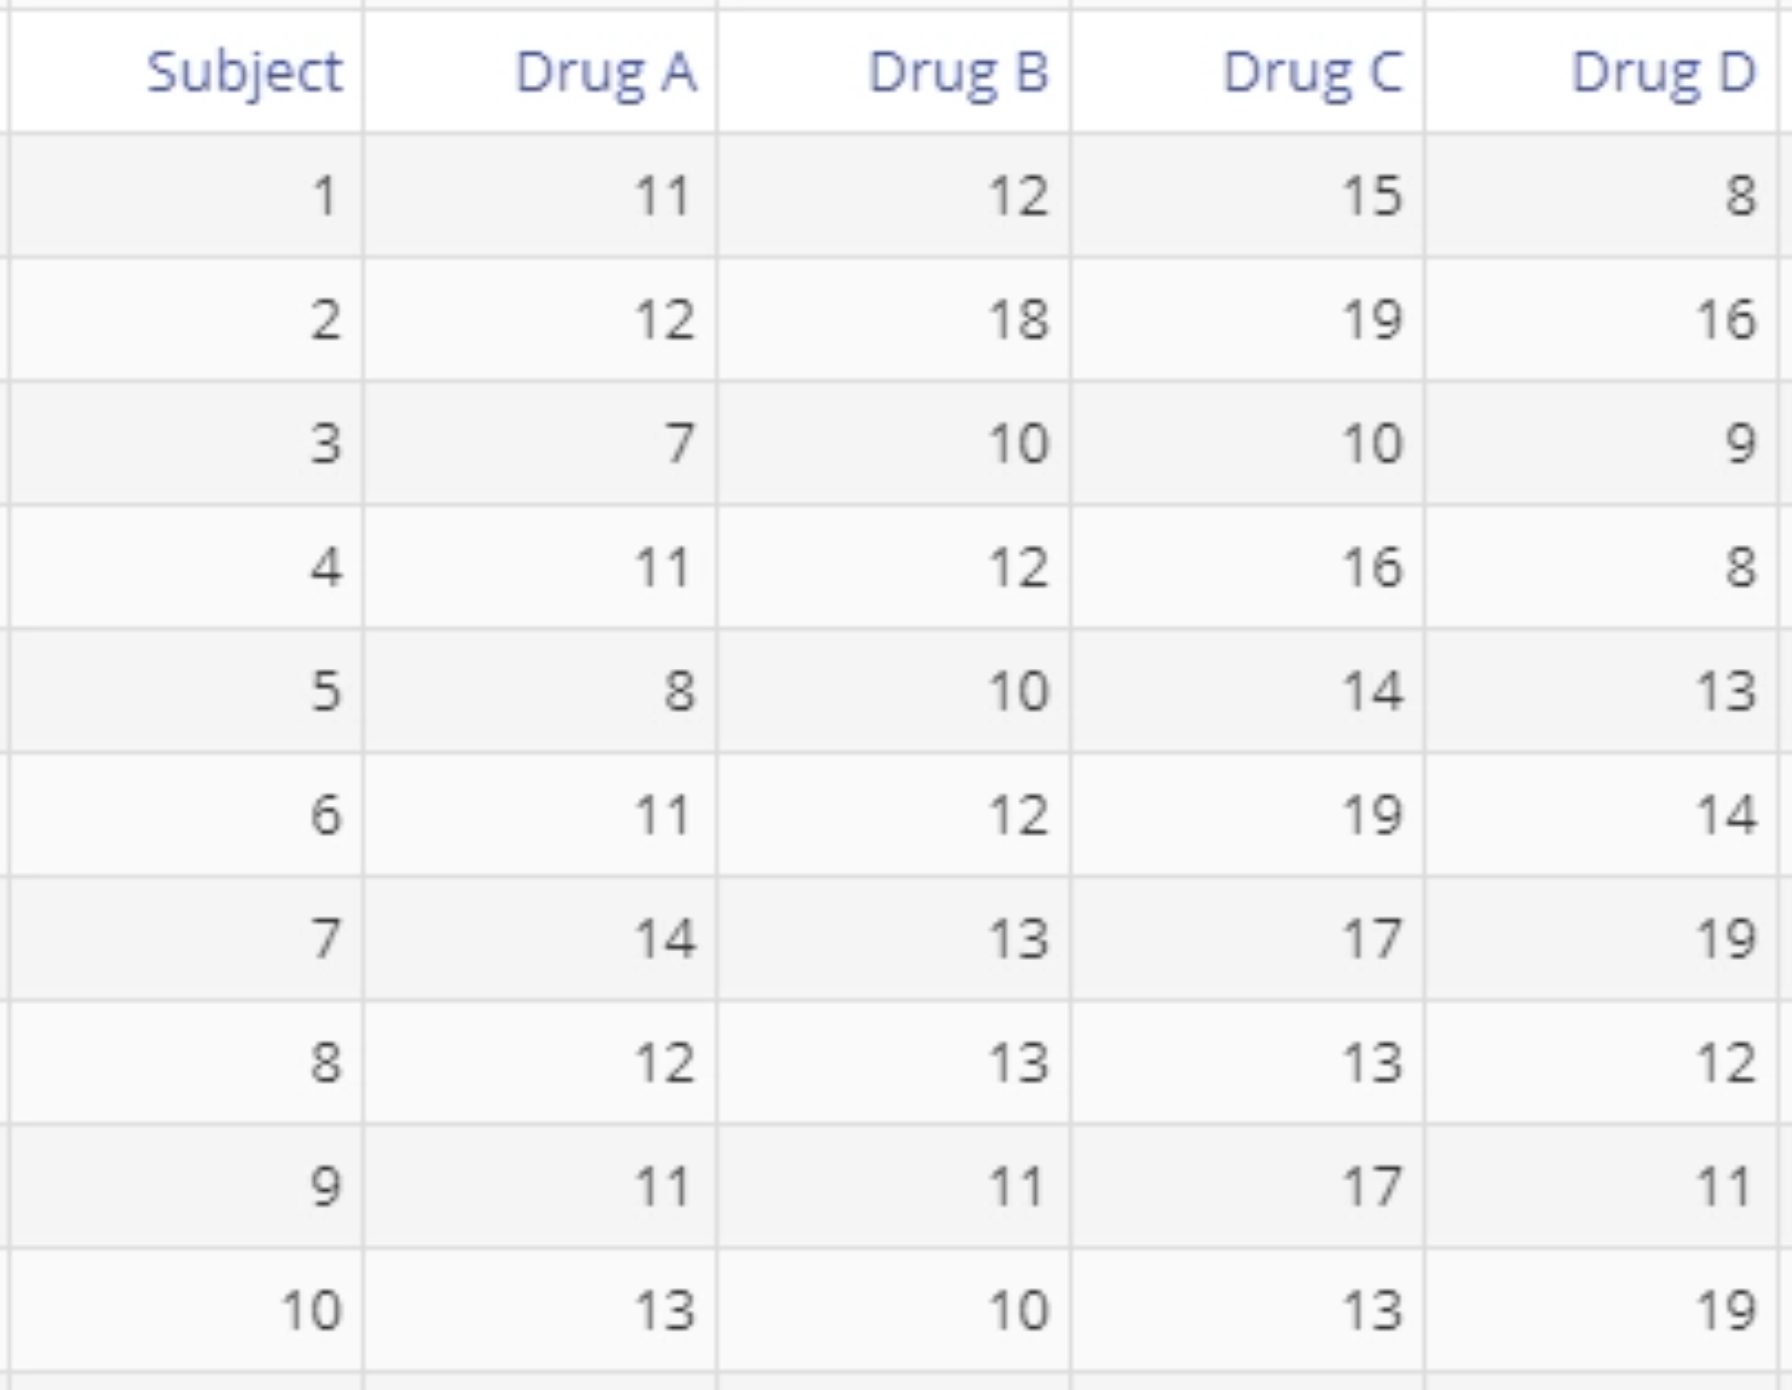
The data for this example consists of four samples of reaction times, one for each drug administered: A, B, C and D. In addition, we have a column of subjects to represent the 10 subjects in the study. We want to test, at the 20% level, whether the reaction times differ across the drugs, while accounting for the variability among subjects.
Steps:
- Select the Analyze menu > Non-parametric > Click on the Friedman Test.
- Click on the data file in the data sources panel and drag the four Drug variables onto the Data Variable drop zones on the study.
- Drag the Subject variable onto the Blocking Variable drop zone.
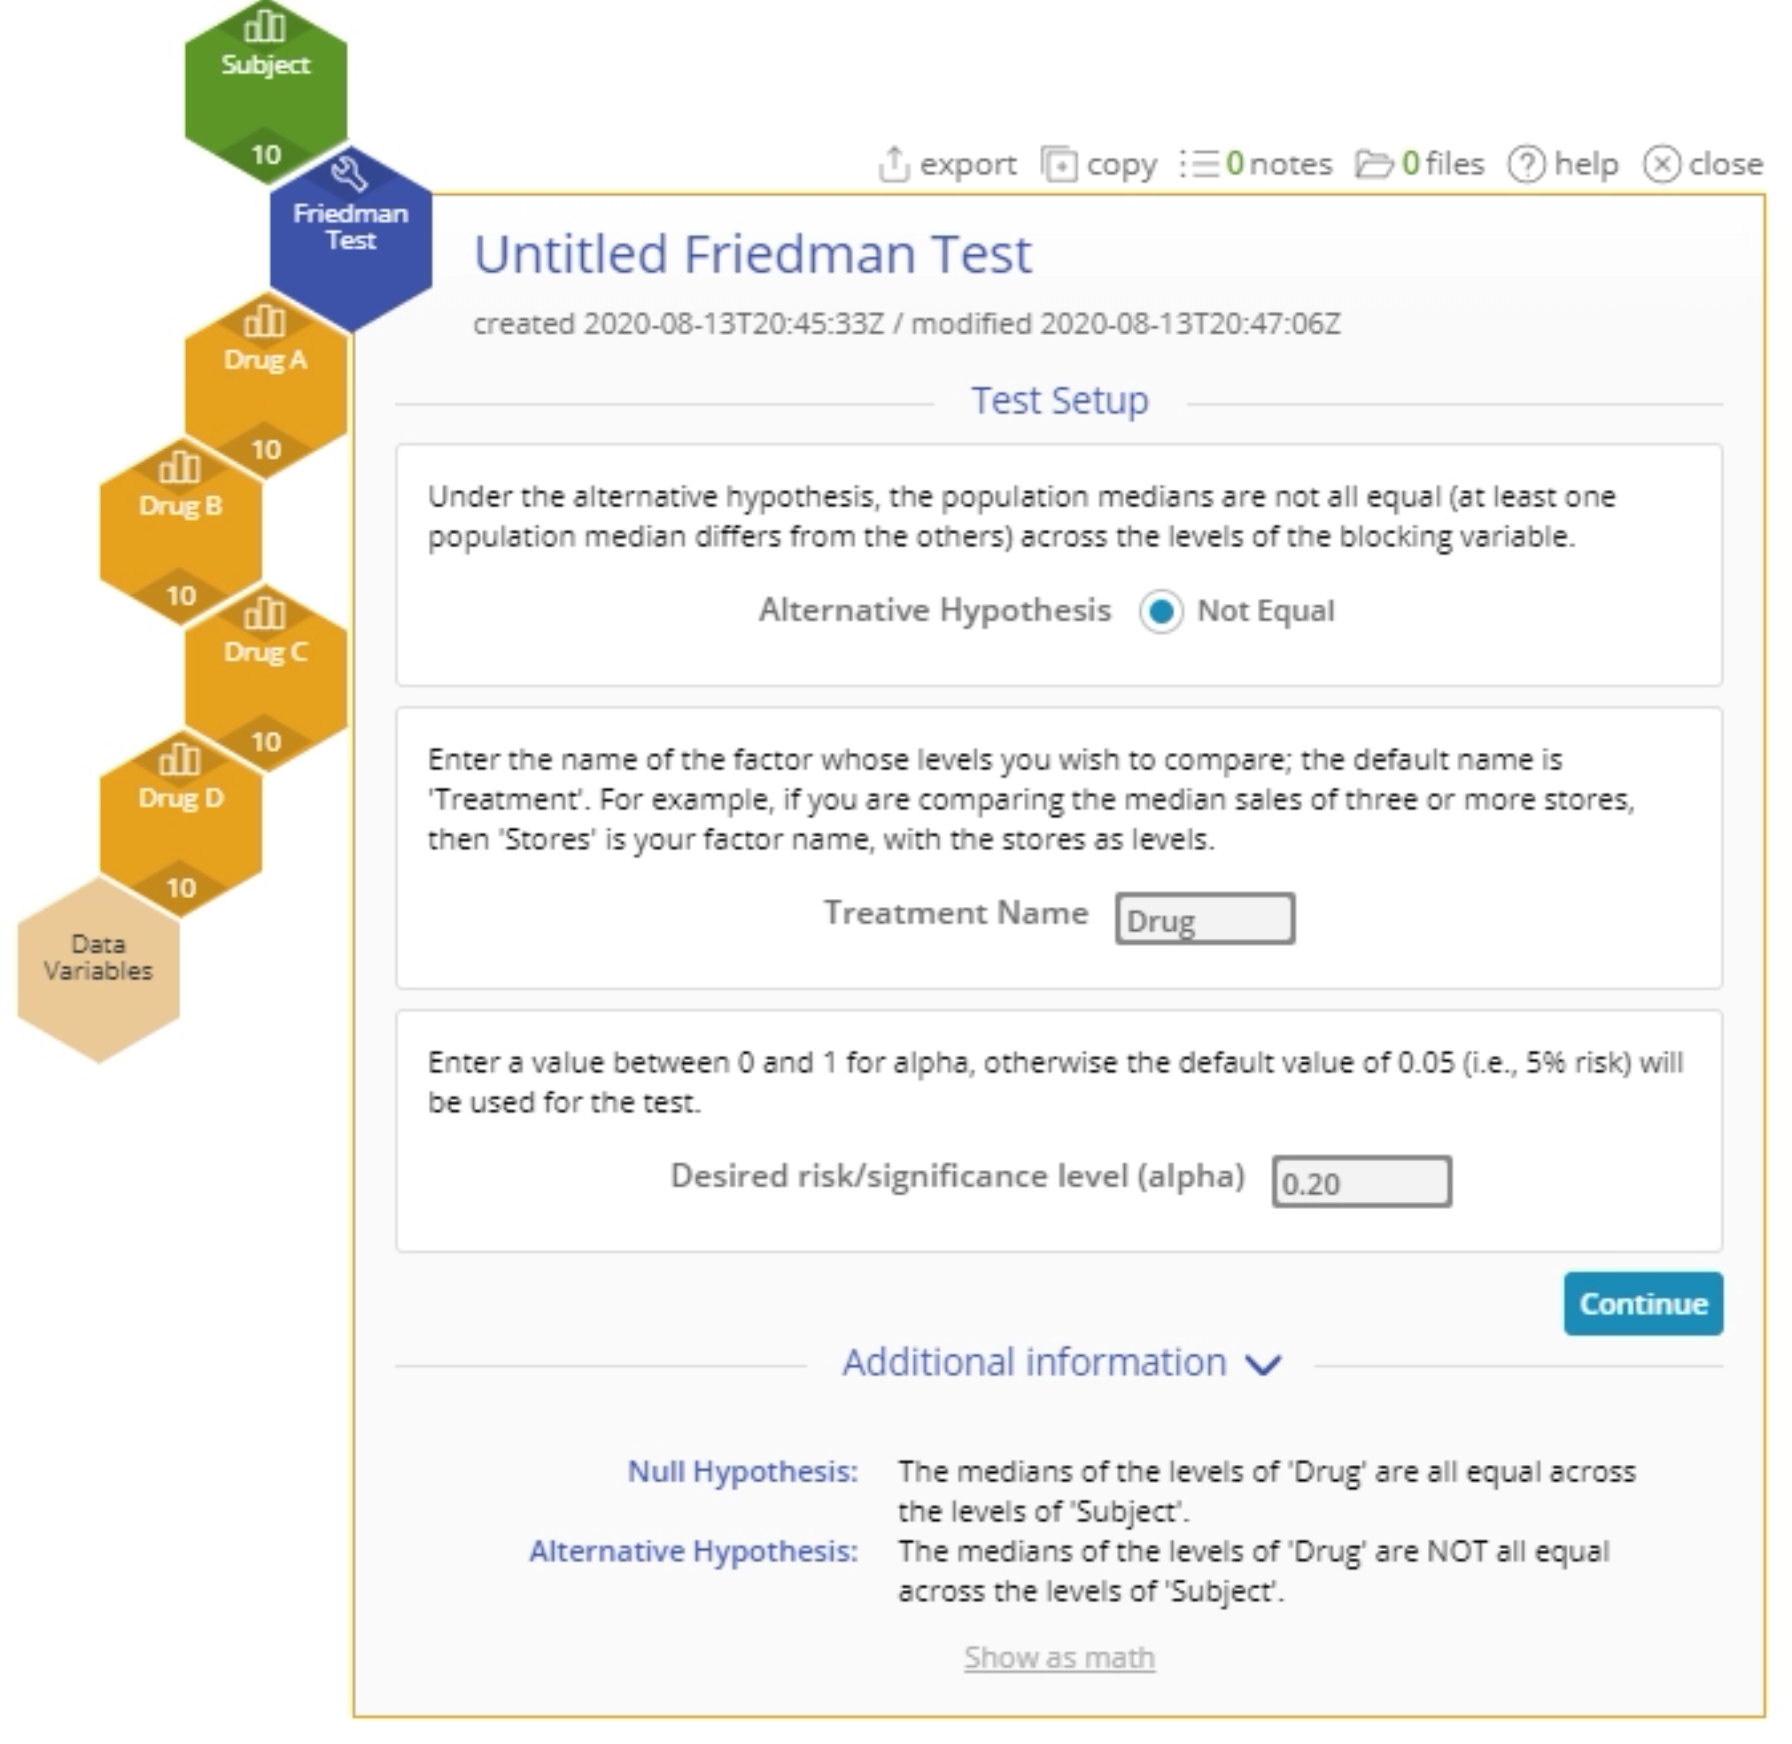
- Set up the test as shown, and click Continue:
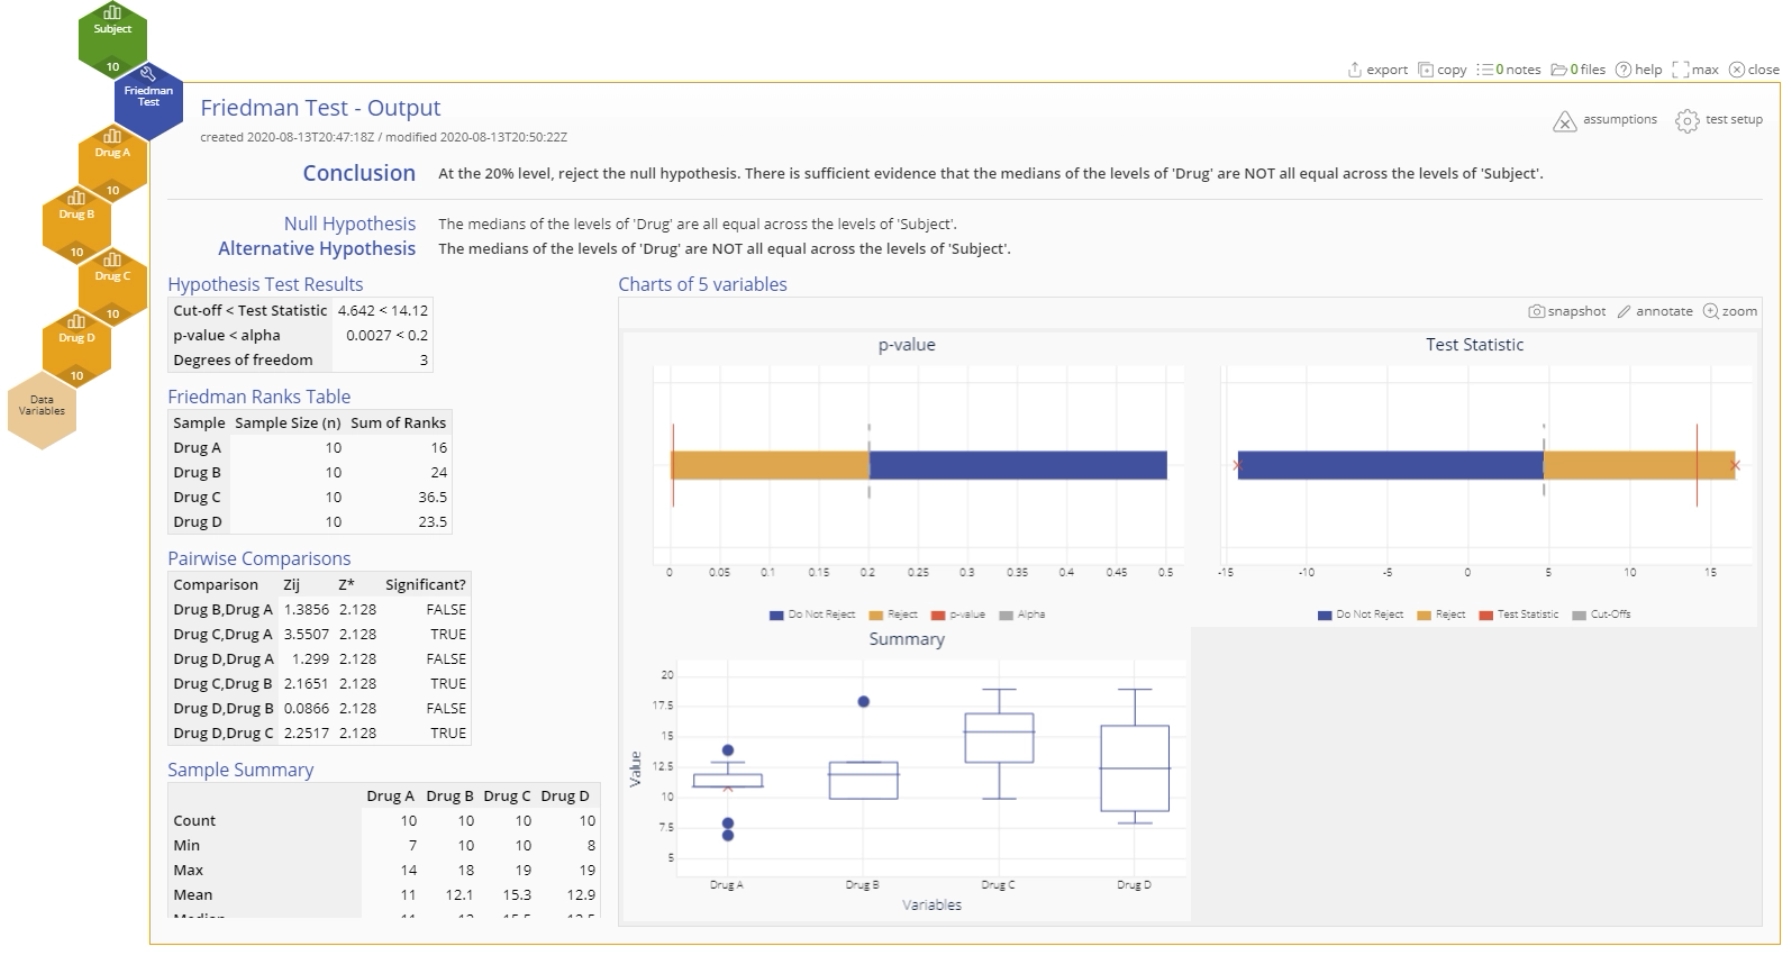
- The Friedman Test output is shown:
The p-value is less than the chosen significance level of 20%, so reject the null hypothesis; at least one drug treatment differs significantly from the others at the 20% level. The Pairwise Comparisons table shows that in particular, drug C differs significantly from each of the others, with the largest pain reduction score.
Friedman Test Video Tutorial
Instructor Resources
Was this helpful?


