
Tips and Tricks for EngineRoom's Diagram Tools
Maps are a major part of solving problems around processes. Quick visualizations of a process (whether a Process Flow Chart, SIPOC, or Value Stream Map) enable you to understand problem areas, communicate about them, and make plans for data collection to solve them. Other tools that utilize these tips include Process Playground and the Root Cause Tree.
Here are a few tips and tricks to get the most out of EngineRoom’s mapping tools.
Automatically Create Connections between Shapes
The auto-connect feature, located at the top of the shapes panel, defaults to being turned on. Leaving this feature on allows you to automatically connect to the selected shape.

Note: For the auto-connect feature to work with any newly dragged-on shapes, the shape must be selected.Don’t want to make a connection? Click on the workspace to deselect all shapes and drag on your new shape.
Multi-select Your Shapes
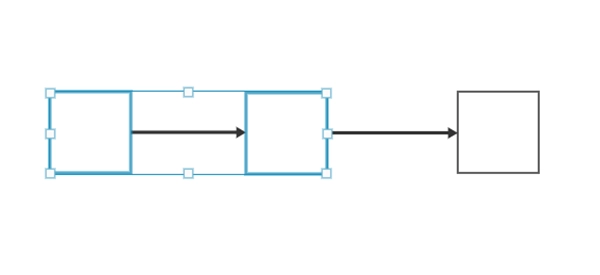
Multi-selecting allows you to move multiple shapes and edit their styles together.
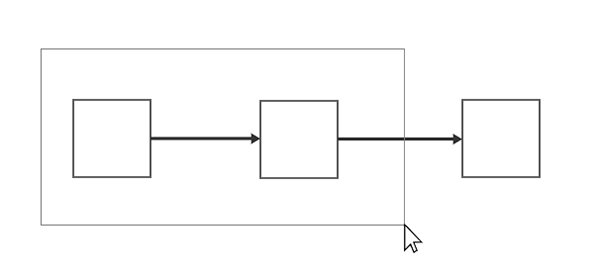
There are two modes for selecting shapes. In “Pan” mode, hold down Shift and then click and drag to select the shape. In “Select” model, clicking and dragging is all you need to do!
To select shapes individually, hold down the Shift, Control, or Command keys before clicking.
Group Your Shapes
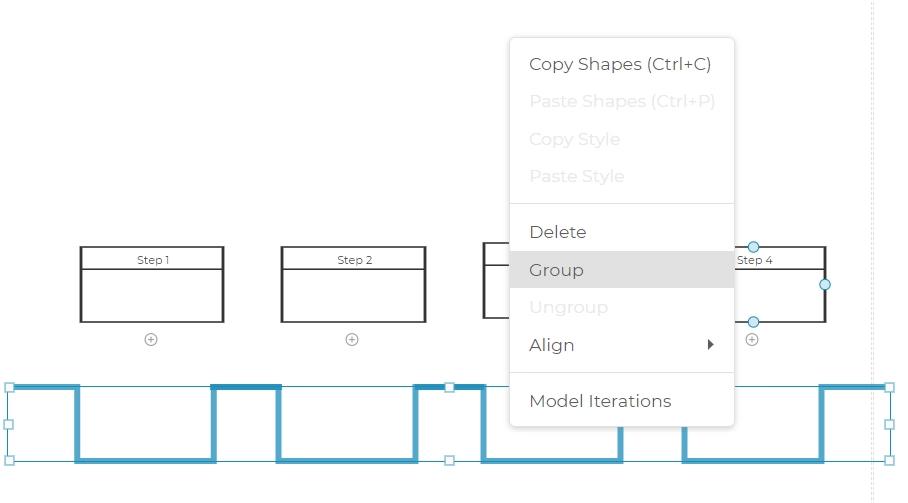
Keep shapes together by grouping them.
Multi-select your shapes, then right-click on one and select “Group.” Need to edit just one? Double-click the shape in the group to edit it individually.
Add Images
To add your own images:
- Copy and Paste your images onto the workspace (Ctrl-C, Ctrl-V)
- Drag your image file onto the workspace
Hide your Data Blocks, Plus Signs, and Labels
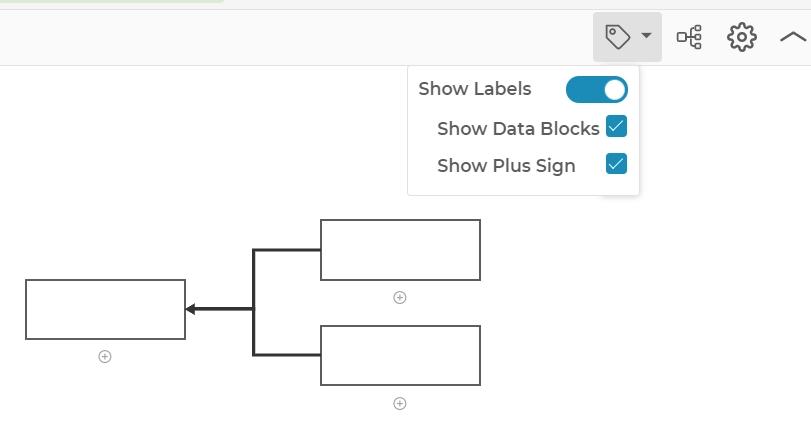
With the Process Playground, Value Stream Mapping, and Root Cause Tree tools, you can add data blocks underneath the shapes but this may visually clutter the map.
To reduce this clutter, use the label button to toggle the data blocks, plus signs, and labels. This feature allows you to view them when you need to and hide them when you don’t.
Was this helpful?